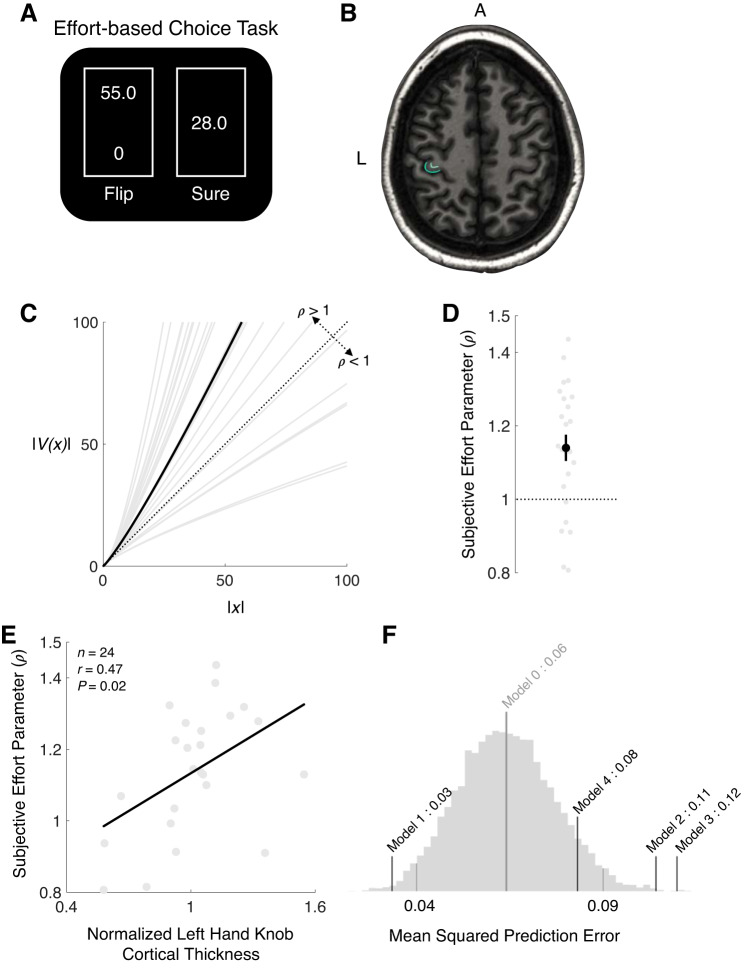
Fig. 1.
Experimental task, behavioral data, and correlation between structural imaging data and behavior. A: during effort-based choice trials participants were presented a series of risky decisions that involved choosing between 2 options: exerting a low amount of effort with certainty (“sure”) or taking a gamble that could result in either a higher level of exertion or no exertion, with equal probability (“flip”). The effort amounts were presented on a 0–100 scale, on which participants were trained during an Association phase before choice. An effort level of 0 corresponded to no exertion and 100 to 80% of a participant’s maximum exertion. Gambles were not realized after a choice. At the end of the Choice phase, to ensure that participants revealed their true preferences for effort, 10 choices were randomly selected and played out such that any effort required would need to be exerted before they completed the experiment. B: a structural image (transverse slice) from an exemplar participant, illustrating a tracing of the left hand knob (in green). L, left. A, anterior. C: the estimated subjective effort cost function [V(x) = xρ] for each participant (gray) and the group median (black). The dashed line indicates an objective valuation of effort (ρ = 1), with curves above this line representing that an incremental change in the effort level results in a greater subjective cost of effort for higher effort levels. D: parameter estimates ρ for individual participants (gray) and the group median (black). The error bar represents the SE. E: between-participant regression considering the relationship between effort subjectivity parameters acquired from the behavioral choice data and normalized left hand knob cortical thickness. Left hand knob thickness was normalized by contralateral hand knob thickness. This relationship illustrates that individuals with a larger hand knob thickness find prospective effort to be more costly (indicated by a larger ρ). F: prediction errors from cross-validation analyses assessing the predictive power of anatomical measures and monetary subjective preferences on subjective effort parameters. Model 0: ρ = unif(ρmin, ρmax); model 1: ρ = β0 + β1 × LHKThickness; model 2: ρ = β0 + β1 · LHKThickness + β2 · LHKSurfaceArea + β3 · LHKVolume + β4 · LM1Thickness + β5 · LM1SurfaceArea + β6 · LM1Volume; model 3: ρ = β0 + β1 ·LHGThickness + β2 · LHGSurfaceArea + β3 · LHGVolume; model 4: ρ = β0 + β1 · λ + β2 · α, where LHK is left hand knob and LM1 is left primary motor cortex, The histogram represents 10,000 samples from the null model (model 0). The mean (center of the distribution) and 95% confidence intervals (tails of the distribution) of the null model are indicated with gray lines. The black lines represent the mean squared prediction errors of the leave-one-out analyses of the other models.

