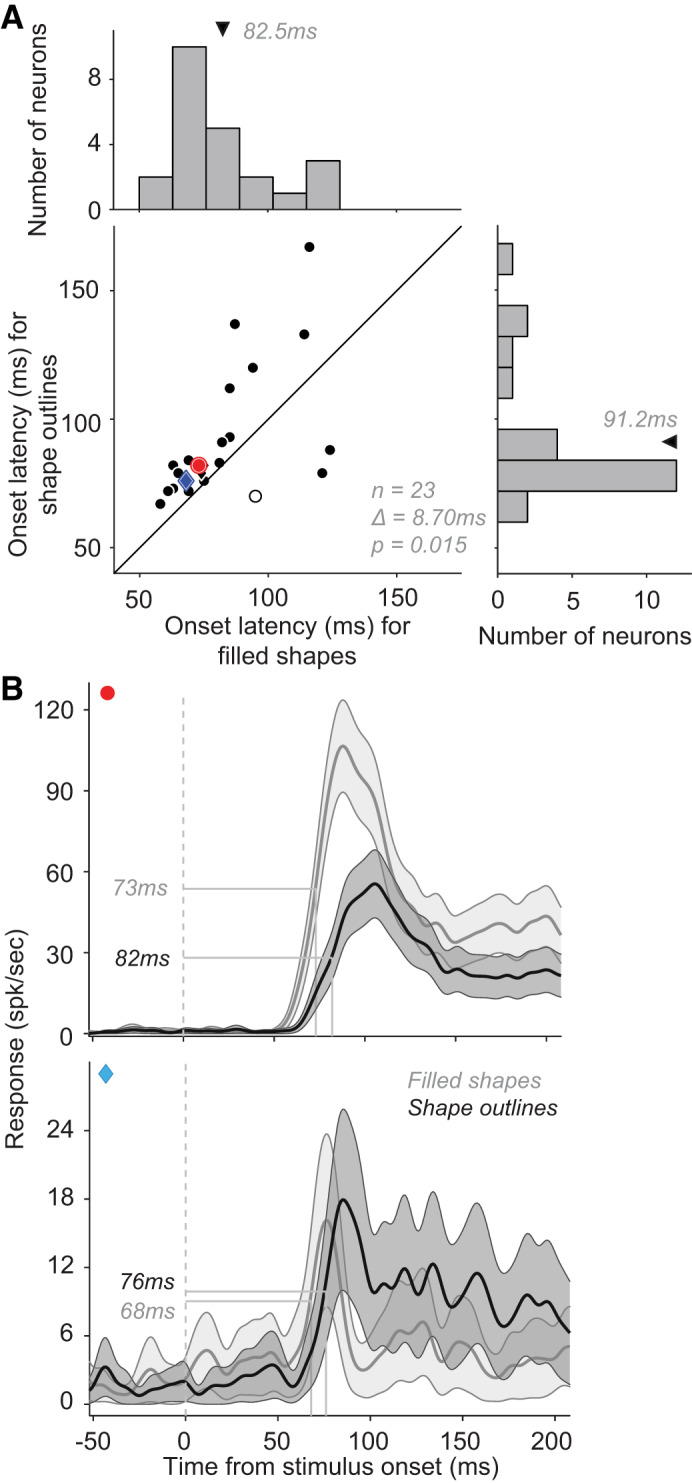
Fig. 4.

Effect of shape interior fill on response onset latency. A: onset latencies of neuronal responses to filled stimuli (abscissa; mean latency ± SD = 82.5 ± 19.8 ms; median = 75 ms) and to stimulus outlines (ordinate; mean latency ± SD = 91.2 ± 25.5 ms; median = 82 ms). Neurons with larger average responses to filled stimuli are represented as circles while those with stronger responses to outline stimuli are represented as diamonds. Open symbols identify neurons with no significant difference between filled and outline stimuli in terms of response latencies. Across the population, mean difference ∆ between filled and outline stimulus latencies = 8.7 ms (Wilcoxon signed-rank test, P = 0.015, n = 23). B: peristimulus time histograms (PSTHs) of 2 example neurons, one that responded more strongly to filled stimuli (top), and another that responded more strongly to outline stimuli (bottom). In both cases, responses emerged significantly earlier for filled stimuli (see red and cyan markers in the scatter in B). Dotted line: stimulus onset. Shaded area: SE.
