Fig. 8.
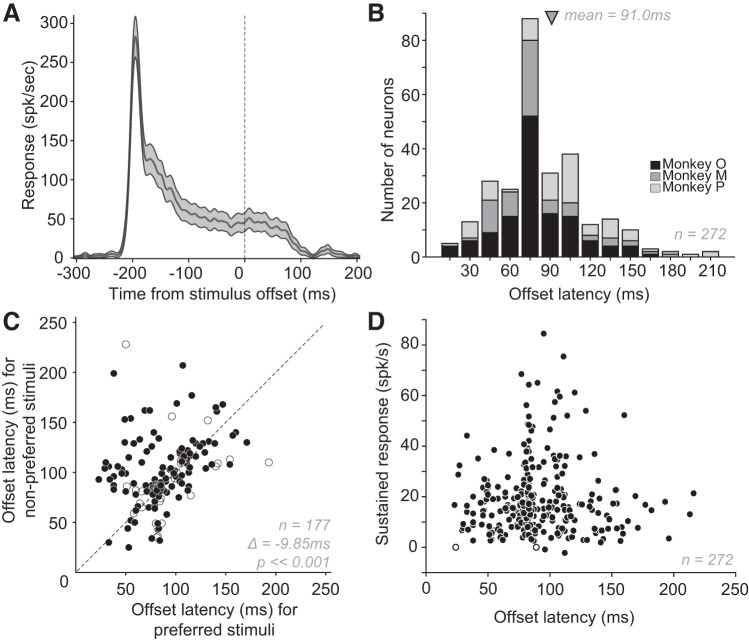
Response offset latencies. A: peristimulus time histogram (PSTH) of an example neuron aligned to stimulus offset (0 ms, dotted line). Stimulus duration was 250 ms, so stimulus onset was roughly at −250 ms; the offset latency for this neuron was 85 ms. Shaded area: SE. B: distribution of offset latencies of 272 V4 neurons from 3 monkeys (shades of grey indicating animals). Offset latencies were calculated based on responses to a variety of shape stimuli using the half-height method (see methods for details). Across V4 neurons, offset latencies ranged from 23 ms to 216 ms. Arrow indicates mean latency ± SD (91 ± 34.4 ms). Median latency = 84 ms. Variability in response offset latency ranged from 0.05 ms to 28 ms (median = 1.8 ms). There was a small but statistically significant negative correlation between the variability of neuronal response and offset latency variability (r = −0.29; P < 0.01). C: response latencies based on preferred and nonpreferred stimuli. Nonpreferred stimuli were associated with significantly longer offset latencies as indicated. D: magnitude of sustained response (baseline-subtracted) in the 100 ms before stimulus offset compared with offset latency. For most neurons (270/272; filled symbols), the sustained response was significantly (P < 0.01) above baseline response that was computed before stimulus onset.

