Fig. 2.
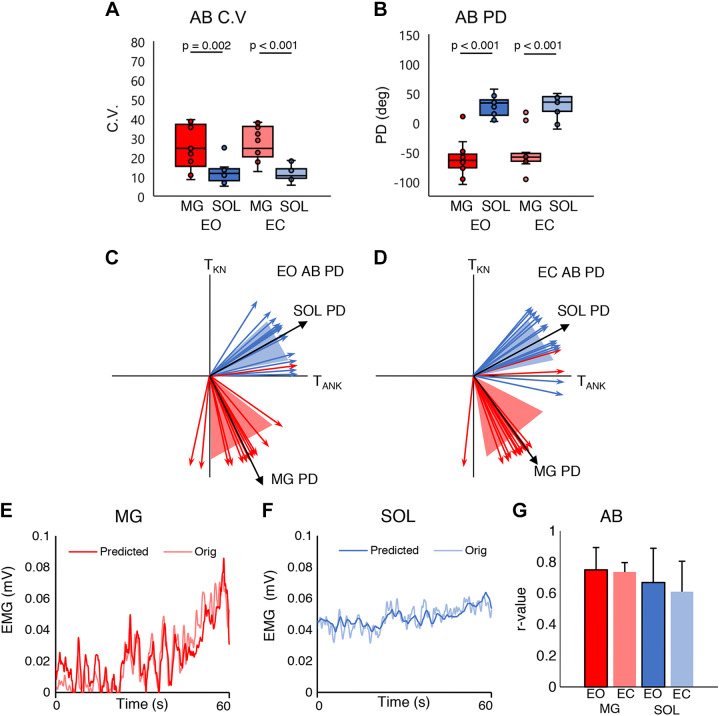
A: distribution of medial gastrocnemius (MG) and soleus (SOL) coefficients of variation (CVs) for eyes open (EO) and eyes closed (EC) conditions in the healthy (AB) group. B: distribution of MG and SOL preferred directions (PDs) for EO and EC conditions in the AB group. Each horizontal bar indicates a P value < 0.05 between the 2 groups under each condition (n = 13 participants). Horizontal lines represent the group median, and the vertical bars represent the furthest outlier or 1.5 times the interquartile range. C: mean ± SD of SOL and MG PDs for the EO condition in the AB group. D: mean ± SD of SOL and MG PDs for the EC condition in the AB group. The black vector is the mean and the shaded area is the SD for each muscle. TANK, plantarflexion torque; TKN, knee torque. E: example time series of the original and predicted AB group’s MG EMG signal; the thick opaque line is the predicted signal, and the thinner translucent line is the original signal. F: example time series of the original and predicted AB group’s SOL EMG signal; the thick opaque line is the predicted signal, and the thinner translucent line is the original signal. G: AB group averages of the correlation coefficient (r) of the predicted and actual MG and SOL EMG activity. Red represents the MG and blue the SOL. Dark colors are EO condition; pale colors are EC condition.

