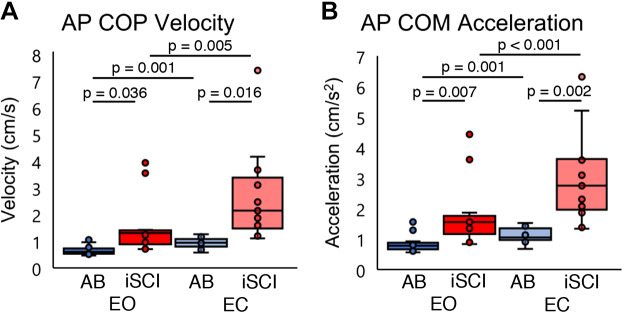
Fig. 3.
A: distribution of the center of pressure velocity (COPVEL) fluctuations in the anterior-posterior (AP) direction for eyes open (EO) and eyes closed (EC) conditions. B: distribution of the center of mass acceleration (COMACC) in the AP direction for EO and EC conditions. Each horizontal bar indicates a P value < 0.05 between the 2 groups under each condition (n = 13 participants). Dark colors are EO condition; pale colors are EC condition. n = 13 participants for all conditions. Horizontal lines represent the group median, and the vertical bars represent the furthest outlier or 1.5 times the interquartile range. AB, healthy; iSCI, incomplete spinal cord injury.

