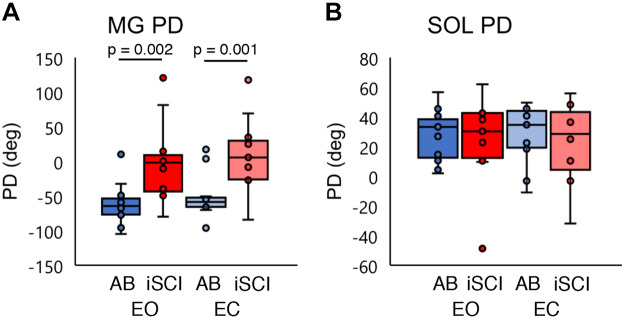
Fig. 5.
A: distribution of the medial gastrocnemius (MG) preferred direction (PD) in both healthy (AB) and incomplete spinal cord injury (iSCI) groups for the eyes open (EO) and eyes closed (EC) conditions. B: distribution of the soleus (SOL) PD in both AB and iSCI groups for the EO and EC conditions. Blue represents the AB group and red the iSCI group. Each horizontal bar indicates a P value < 0.05 between the 2 groups under each condition (n = 13 participants). Dark colors are EO condition, pale colors are EC condition. n = 13 for all conditions. Horizontal lines represent the group median, and the vertical bars represent the furthest outlier or 1.5 times the interquartile range.

