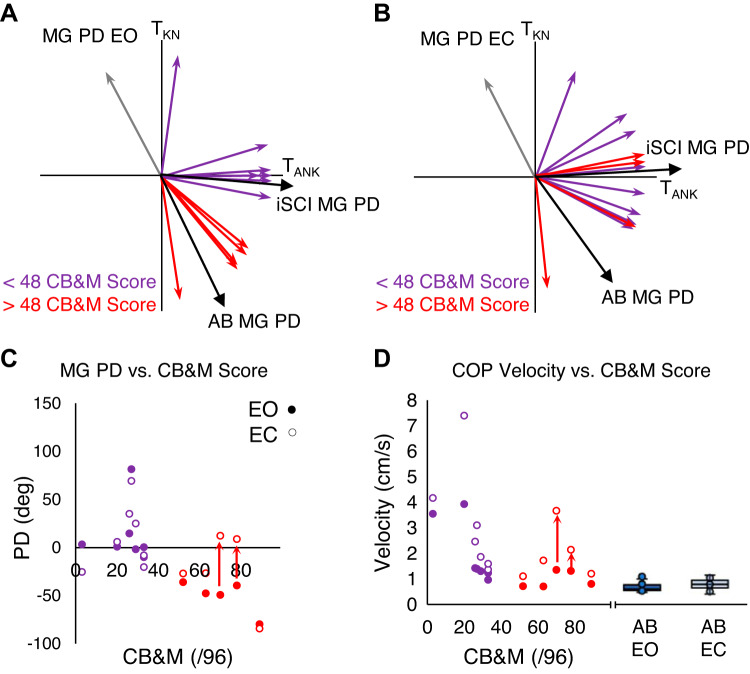
Fig. 6.
A: distribution of medial gastrocnemius (MG) preferred directions (PDs) in participants with incomplete spinal cord injury (iSCI) in the eyes open (EO) condition. B: distribution of MG PDs in participants with iSCI in the eyes closed (EC) condition. Participants with a Community Balance and Mobility (CB&M) score > 48 are in red, and those with a score < 48 are in purple. The gray arrows are the individual who did not perform the CB&M assessment. C: scatterplot of MG PDs in participants with iSCI in both EO and EC condition against the CB&M score. D: scatterplot of center of pressure velocity (COPVEL) in EO and EC conditions. Red arrows indicate direction of change for the MG PD from the EO to EC condition in the 2 individuals with iSCI who demonstrated a high CB&M score but had postural sways greater than those typically observed in the healthy (AB) group. Box plots indicating the median (middle line), 75th and 25th percentile values (top and bottom of box), and 1.5 times the interquartile range (top and bottom whiskers) are shown for the AB group’s COPVEL in EO (solid blue) and EC (light blue) conditions on right of scatterplots for comparison.

