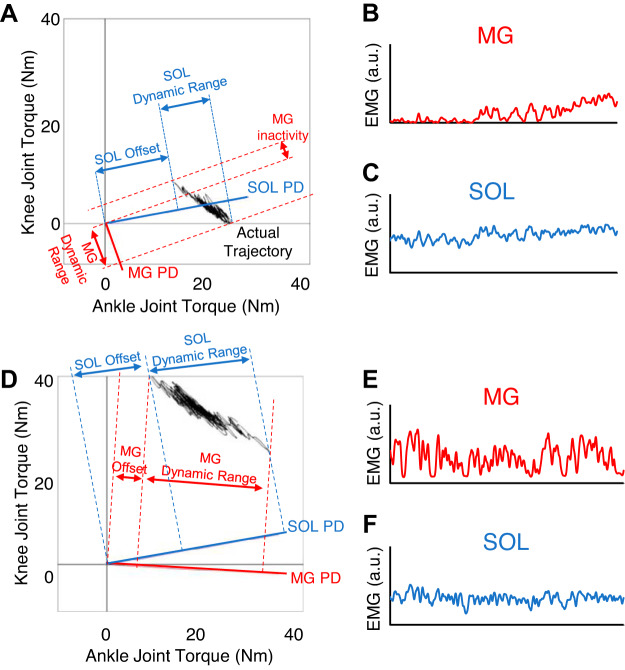
Fig. 7.
A: representative image of joint torque trajectory during quiet standing in a healthy (AB) individual along with the orthogonal projection to both the medial gastrocnemius (MG) and soleus (SOL) preferred directions (PDs). B: representative 60-s time series of the MG muscle activity to highlight its phasic activity. C: representative 60-s time series of the SOL muscle activity to highlight its tonic activity. B and C are representative time series from an individual in the AB group. D: representative image of joint torque trajectory during quiet standing in an incomplete spinal cord injury (iSCI) individual along with the orthogonal projection to both the MG and SOL PDs. E: representative 60-s time series of the MG muscle activity to highlight its phasic activity. F: representative 60-s time series of the SOL muscle activity to highlight its tonic activity. E and F are representative time series from an individual in the iSCI group. a.u., Arbitrary units.

