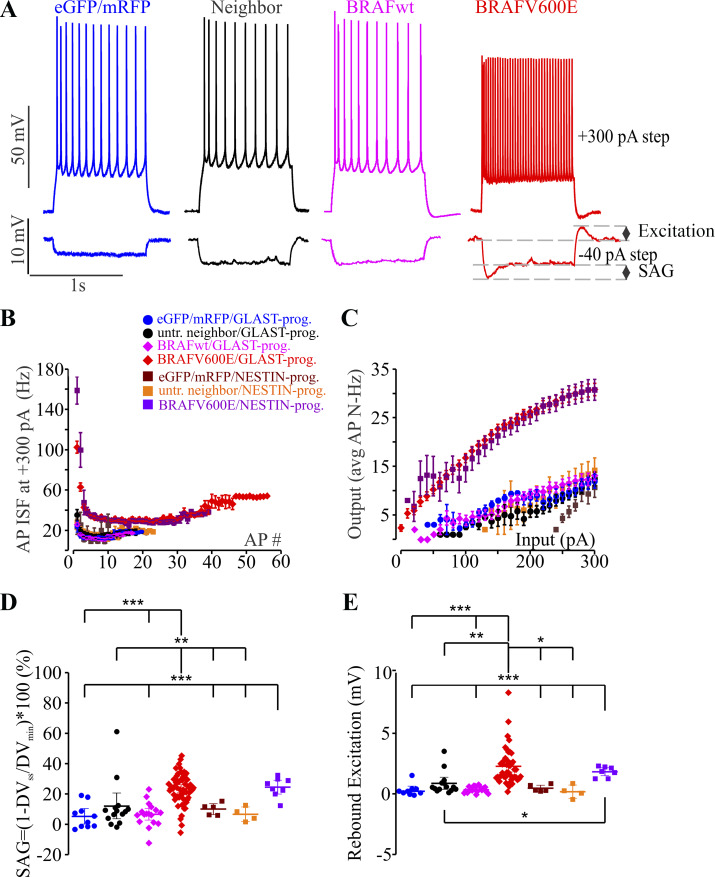
Fig. 1.
BRAFV600E-expressing pyramidal neurons are hyperexcitable. A: representative traces of voltage recordings from 4 pyramidal neurons in parietal somatosensory cortex in 4 different conditions. Each neuron is shown responding to 300-pA depolarizing current injection and −40-pA, 1-s hyperpolarizing current injection. Representative traces show the representative phenotypic differences between neurons expressing monomeric red fluorescent protein (mRFP) and/or enhanced green fluorescent protein (eGFP) alone (blue), untransfected cells neighboring BRAFV600E-transfected cells (neighbor; black), a cell expressing wild-type BRAF (BRAFwt; magenta), and BRAFV600E-transfected neurons (red). B: instantaneous frequency (ISF) of action potentials (APs) in the train at +300-pA, 1-s depolarizing current steps was significantly higher in GLAST-prog. BRAFV600E-transfected neurons compared with all other conditions. One-way ANOVA (F6,93–104 = 7.7–28.06, P = 1.0122E-19 to 0.045424; see Supplemental Table S1 at http://doi.org/10.17605/OSF.IO/NRWT2 for more extended statistical comparisons) with Tukey post hoc correction, Welch’s test with Games–Howell post hoc correction, or independent-samples equal variance 2-tailed t tests were used. For instance, the ISF was significantly higher in GLAST-prog. (n = 64) and NESTIN-prog. (n = 8) BRAFV600E neurons compared with untransfected neighbors (n = 7) for the first 3 action potentials in the train (Welch’s test: t6,16.779–18.594 = 14.113–33.123, P = 5E-06 to 2.11E-08 with Games–Howell post hoc correction, P = 1E-06 to 2.01E-07). C: input-output curve shows more than 2 times higher AP firing frequency in GLAST-prog. BRAFV600E-transfected neurons (n = 48) and NESTIN-prog. BRAFV600E transfected neurons (n = 7) compared with all other conditions: GLAST-prog. untransfected neighbor (n = 8), GLAST-prog. eGFP/mRFP (n = 11), GLAST-prog. BRAFwt (n = 13), NESTIN-prog. eGFP/mRFP (n = 3), and NESTIN-prog. untransfected neighbor (n = 6). One-way ANOVA (F6,89 = 33.064–40.874, P = 9.49E-24 to 4.94E-02) with Tukey post hoc correction was used (see Supplemental Table S1 for more extended statistical comparisons). D: sag ratio (SAG) to hyperpolarization is significantly larger in BRAFV600E neurons (n = 57). One-way ANOVA with Tukey’s post hoc tests (F6,108 = 11.46, P = 6.93E-10) was used. **P < 0.01; ***P < 0.001, Tukey post hoc tests (see Supplemental Table S1 for more extended statistical comparisons). E: rebound excitation was significantly larger in BRAFV600E neurons (n = 42). Welch’s test (t6,18.867 = 18.345, P = 6.01E-7) was used to test for significance overall with Games–Howell post hoc correction, and independent-samples 2-tailed t tests were used for statistical comparisons between groups with small sample size. *P < 0.05; **P < 0.01; ***P < 0.001, Tukey or Games–Howell post hoc tests or independent-samples 2-tailed t test. Extended statistical information and comparisons are provided in Supplemental Table S1. AP#, no. of action potentials; AP N, action potential firing frequency; DVmin, minimal initial voltage deflection; DVss, change in stable-state voltage; untr., untransfected.

