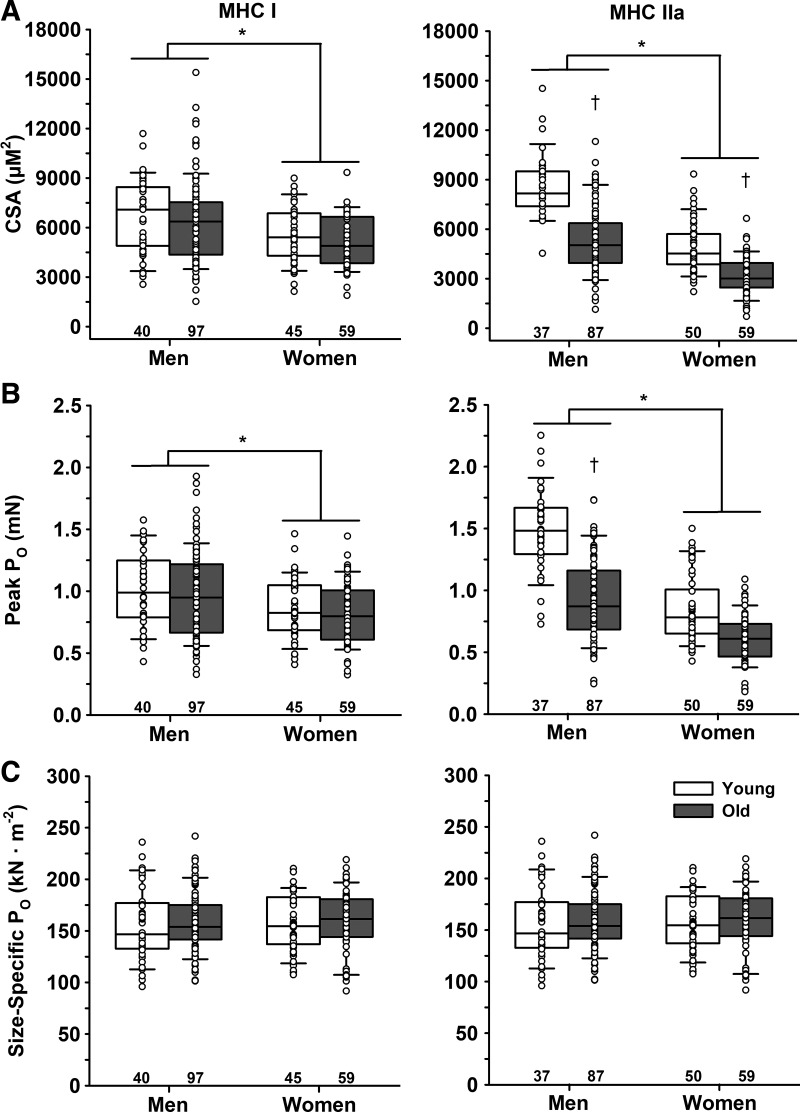
Fig. 1.
Cross-sectional area (CSA), peak force (Po), and size-specific force of single muscle fibers. A: CSA. Men had greater CSA in both slow MHC I and fast MHC IIa fibers compared with women. There was no age difference in CSA of MHC I fibers; however, MHC IIa fibers from old men and women were smaller than their younger cohort. B: peak force (Po) in maximal Ca2+ (pCa 4.5). Men had greater Po in both MHC I and IIa fibers compared with women. There was no age difference in Po for MHC I fibers; however, Po of MHC IIa fibers was lower in old compared with young, and young men had a greater Po than all other groups. C: size-specific Po in maximal Ca2+ (pCa 4.5). There were no age or sex differences in size-specific Po for either MHC I or IIa fibers, indicating that the age and sex differences in absolute Po were explained by fiber size. *Significant effect of sex. †Significant effect of age. Significance level P < 0.05. The horizontal line in each box plot indicates the median, while the whiskers represent 1.5 times the upper- and lower-interquartile range. Each dot is an individual fiber, with the number of fibers (n) displayed below the box plots. Data were analyzed using a nested ANOVA.

