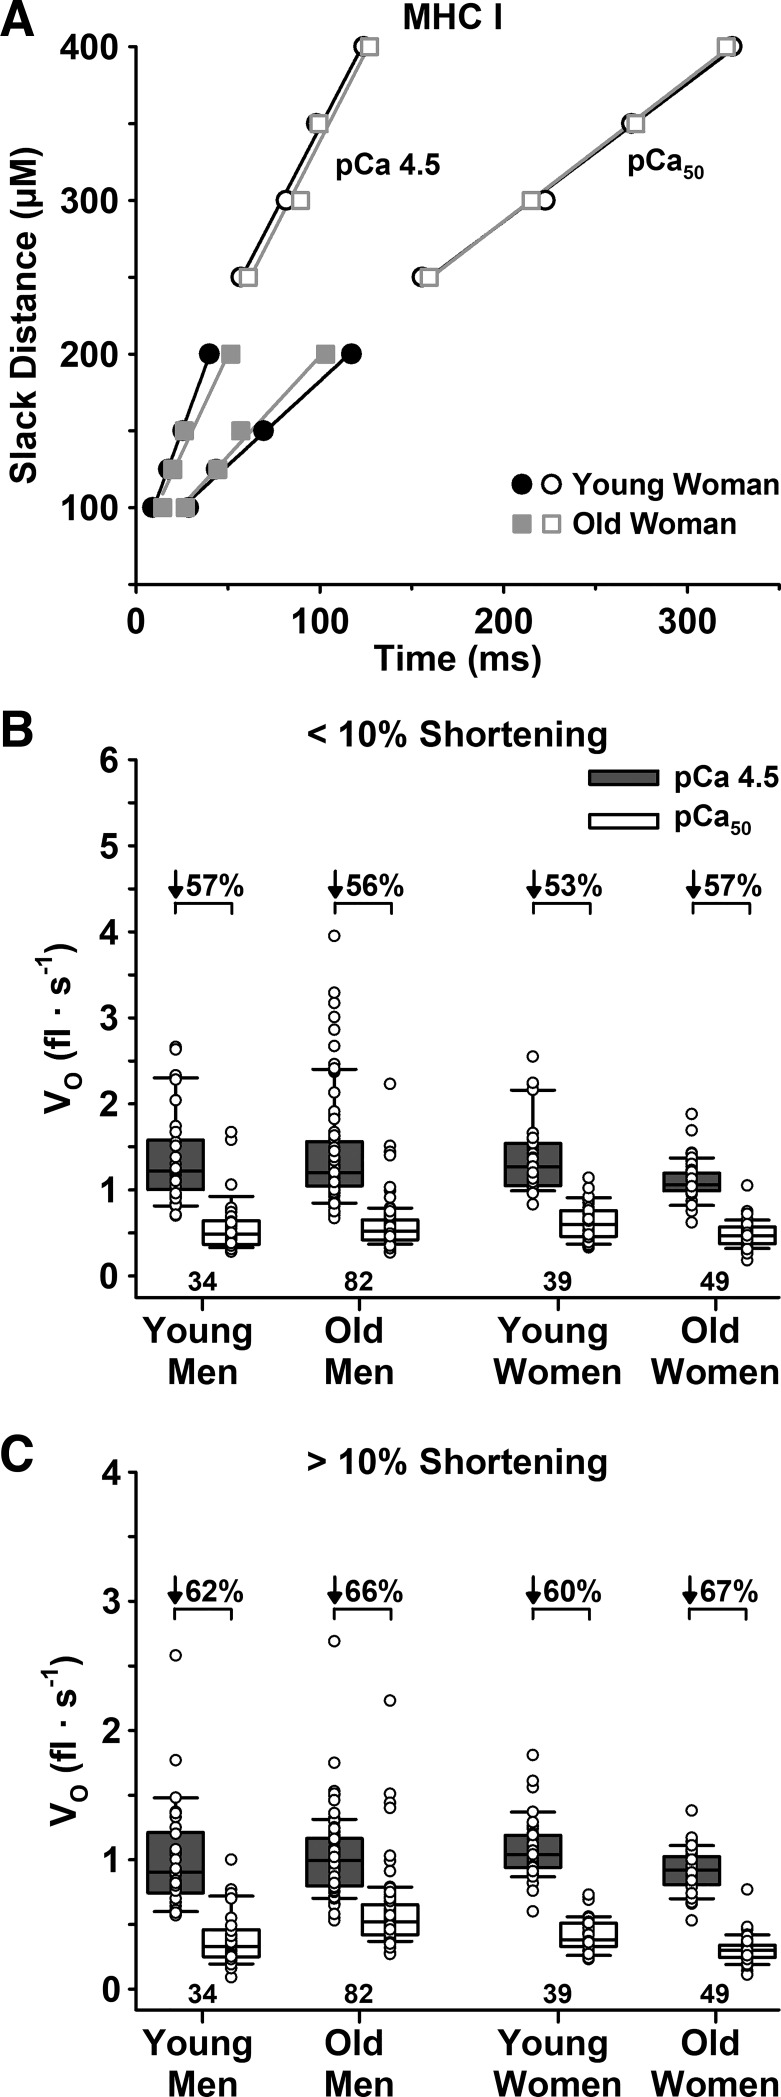
Fig. 5.
Unloaded shortening velocity (Vo) of slow MHC I fibers measured below and above 10% shortening in maximal (pCa 4.5) and half-maximal (pCa50) Ca2+. A: representative plot of individual fibers from a young and old woman for Vo below (filled symbols) and above (open symbols) 10% shortening in both pCa 4.5 and pCa50. B: group means for Vo below 10% shortening in both pCa 4.5 and pCa50. C: group means for Vo above 10% shortening in both pCa 4.5 and pCa50. There were no age or sex differences in Vo below or above 10% shortening in either pCa 4.5 or pCa50. Significance level P < 0.05. The horizontal line in each box plot indicates the median, while the whiskers represent 1.5 times the upper- and lower-interquartile range. Each dot is an individual fiber, with the number of fibers (n) displayed below the box plots. Data were analyzed using a nested ANOVA.

