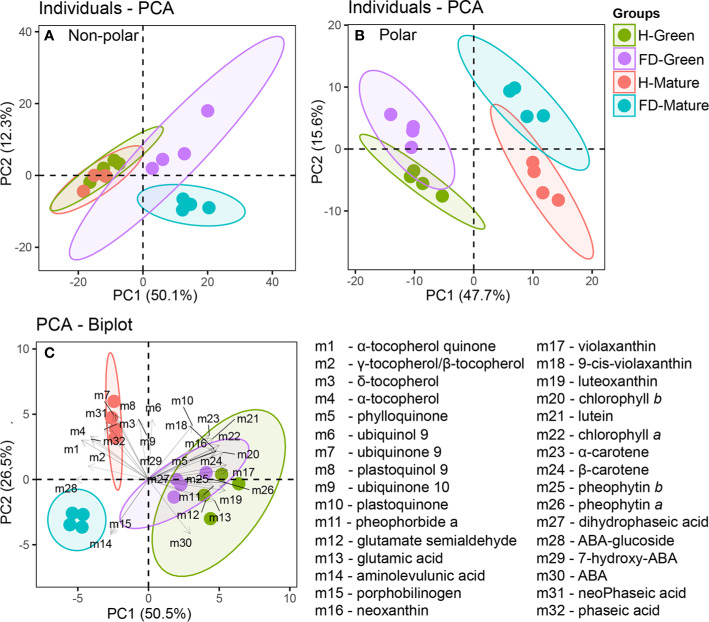
Figure 2.
Principal Component Analysis (PCA) of untargeted and targeted metabolites measured in leaves of healthy (H-green and red dots) and flavescence dorée-infected (FD-violet and blue dots) vines cv. ‘Loureiro’, collected in two grape berry development stages (green and mature). (A) untargeted nonpolar metabolome; (B) untargeted polar metabolome and (C) BiPlot of chlorophyll precursors, chlorophylls, carotenoids, tocochromanols, quinones and ABA and ABA catabolites. Biological replicates in the score plots are shown with the same color within each sample condition and developmental stage, and the length of the arrows associated to each compound is proportional to its contribution to the overall sample distribution.

