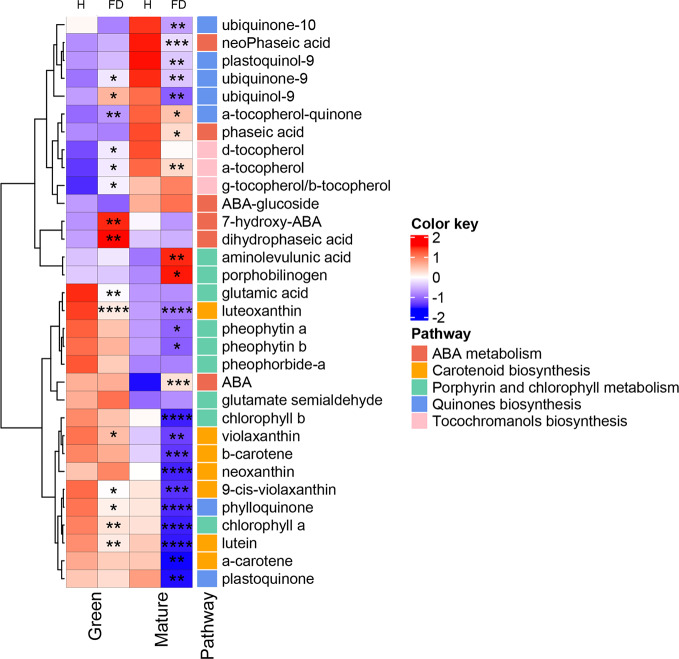
Figure 3.
Heatmap of the modifications observed in chlorophyll precursors, chlorophylls, tocochromanols, quinones, carotenoids and ABA compounds in leaves of healthy (H) and flavescence dorée-infected (FD) vines cv. ‘Loureiro’, collected in two grape berry development stages (green and mature). Each row represents a metabolite and each column represents a sample development stage. Values were centered and scaled in the row direction to form virtual colors as presented in the color key, in which the offset was determined by the average values found within the four biological replicates of each sample type, and the scaling was defined according to the corresponding standard deviation. Metabolites were labeled according to their position in the biosynthetic pathways. Asterisks indicate statistical significance between FD-infected and the respective control (H-healthy) within each sample type following Student’s t-test: *P ≤0.05; **P ≤0.01; ***P ≤0.001; ****P ≤0.0001.

