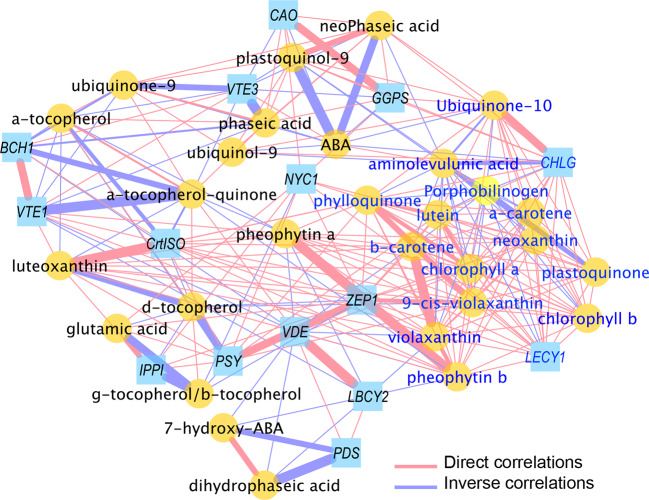
Figure 6.
Correlation network of transcripts and metabolites from healthy (H) and flavescence dorée-infected (FD) grapevines cv. ‘Loureiro’ leaves collected at green and mature stage of grape berry development. Network is visualized with lines joining the nodes (edges) represent correlations (ρ>|0.70|); direct (positive) correlations are shown in red, while inverse (negative) correlations are shown in blue. Edge thickness is proportional to the respective correlation value (ρ). Node shapes represent a gene transcript (squares) or a metabolite (circles) from different biosynthetic pathways. For more details, see Material and Methods and Supplementary Table S5.

