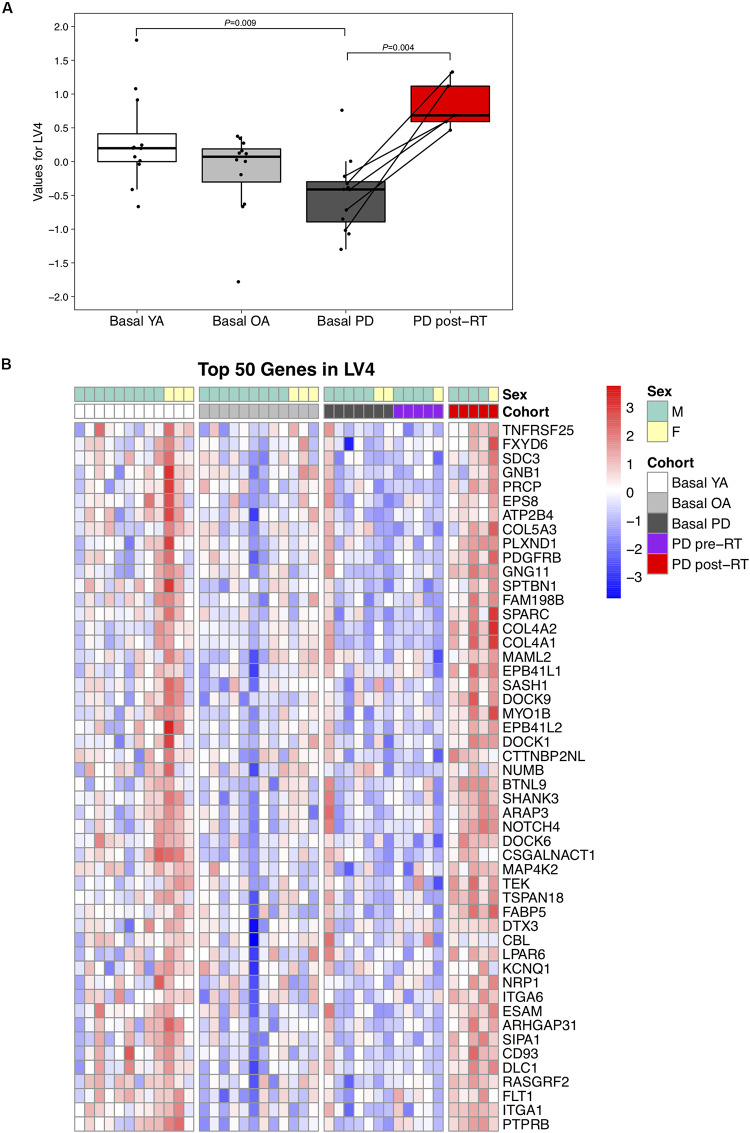
FIGURE 2.
(A) Difference in LV (latent variable) 4 across study groups Basal YA (young adults, n = 12), Basal OA (older adults, n = 12), Basal PD (Parkinson’s disease, n = 12), and PD post-RT (rehabilitation training, n = 5). Individual points are shown for each subject, and lines represent the change within the five individuals with PD that underwent RT. Among the basal groups, LV4 was significantly lower in PD vs. YA (P = 0.009) and increased following RT (P = 0.004). (B) Heatmap showing normalized expression of the top 50 genes in LV4, illustrating expression profile across study groups. Full gene names are available in Supplementary Data Sheet 3.

