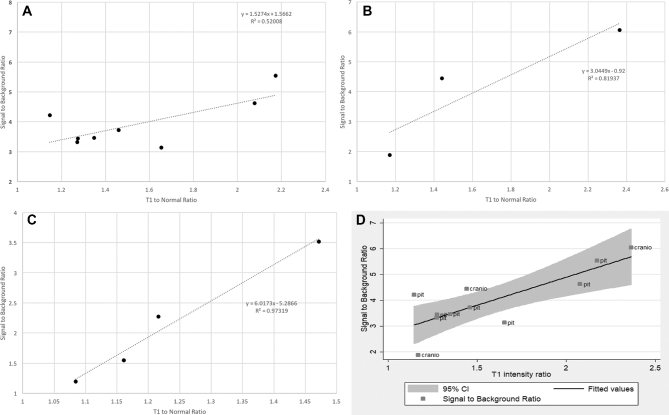
FIGURE 5.
NIR signal is correlated with gadolinium enhancement by MRI. A, T1-to-normal ratio vs SBR for all pituitary adenomas and craniopharyngiomas combined with 95% confidence interval. B, T1-to-normal ratio vs SBR for pituitary adenomas. C, T1-to-normal ratio vs SBR for cranoipharyngiomas. D, T1-to-normal ratio for chordomas.

