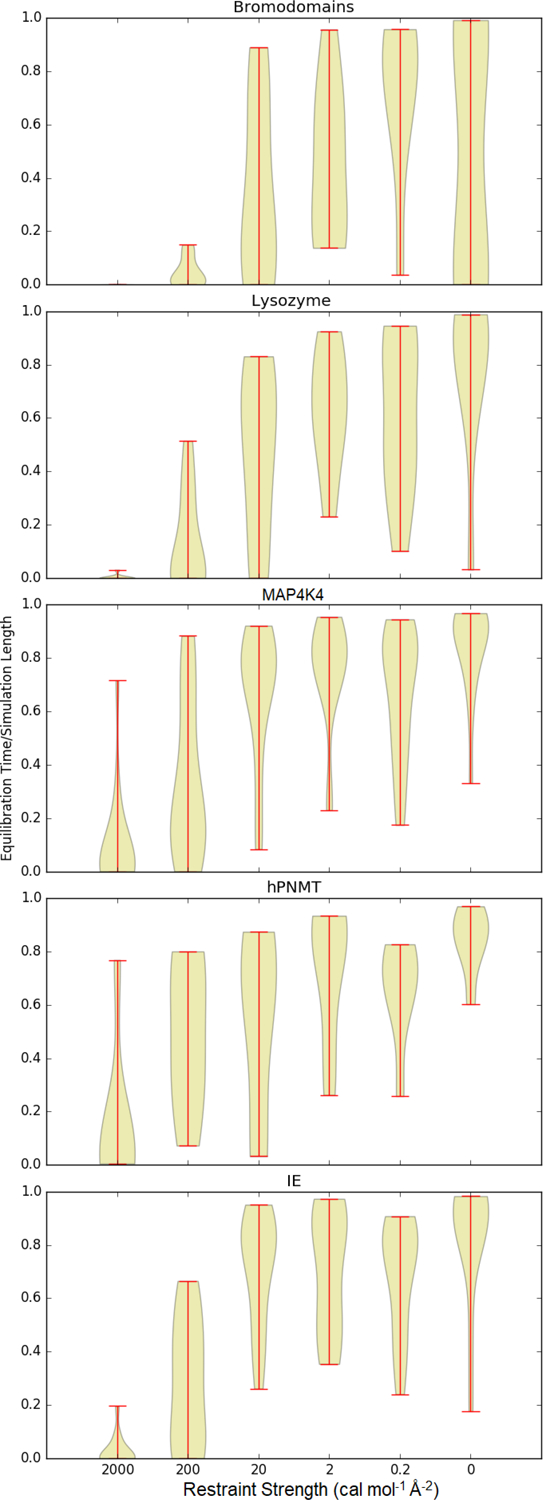
Figure 2:

Equilibration times for each system at each spring constant, as a fraction of the total simulation length. This figure is a violin plot, in which the thickness of the colored region is proportional to the number of systems and ends of the lines indicate the range of observations.
