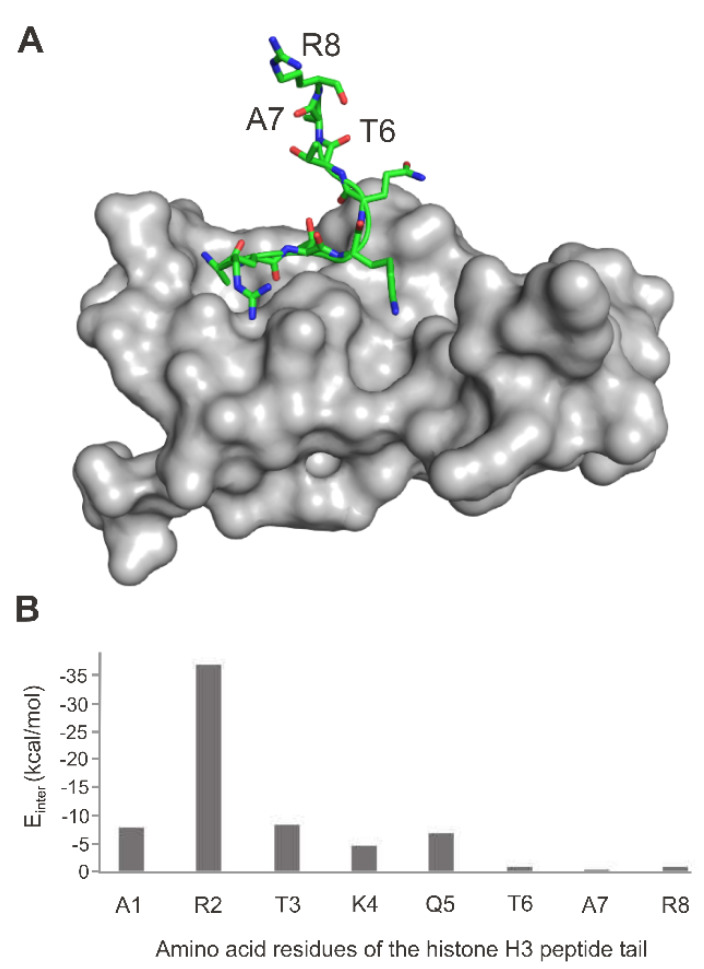
Figure 5.
The structure (A) of the UHRF protein PHD finger (grey surface) in complex with histone H3 peptide tail (sticks, PDB ID 3sou). The figure was rendered by PyMol [47]. (B) Per residue peptide–protein interaction energies (Einter, bottom) were calculated after energy-minimization of the crystallographic complex. Einter values were calculated as a sum of Lennard-Jones and Coulomb interaction energies as described previously [99]. After the first 5 amino acid residues of the histone peptide, Einter diminishes as the last three residues interact with the bulk.

