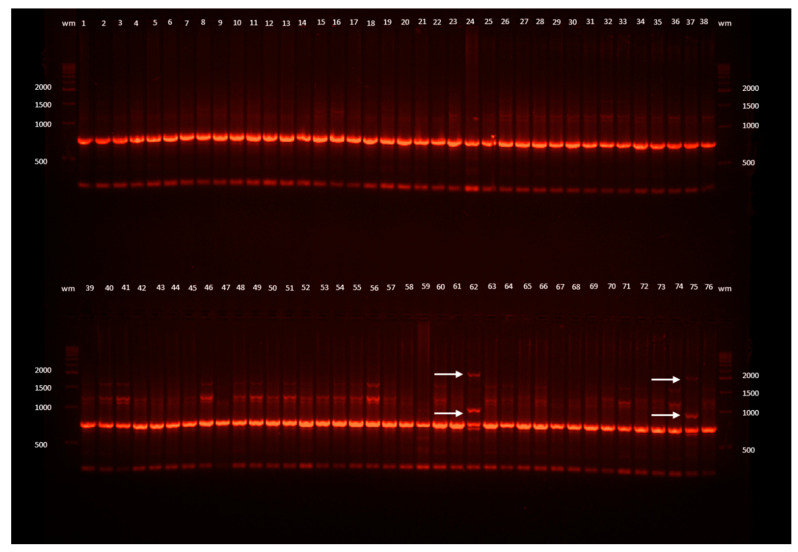
Figure 1.
Example ISSR band profiles of L. spectabilis ‘Gold Heart’ received as a result of electrophoresis of the DNA amplification products obtained with the I-D primer. Outermost lanes (wm) are DNA bp weight markers; 1, 2, 3, ... are the numbers of the plants: 1–29 recovered after encapsulation-vitrification (EV) cryopreservation, 30–54 after droplet-vitrification (DV), 55–70 after vitrification (V), 71–76 untreated control plants (C); arrows point to changed band profiles.

