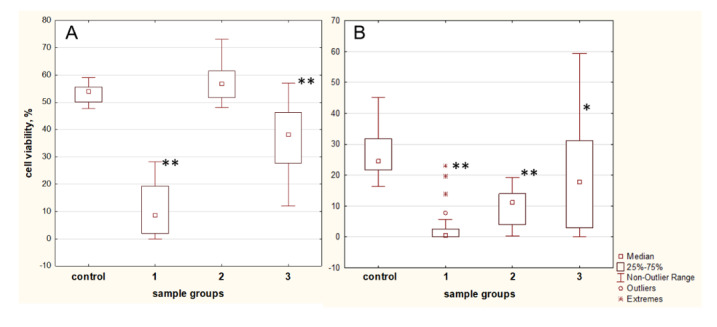
Figure 8.

Antioxidant properties of blood plasma samples of T2D patients assayed by the MTT assay on the H2O2 oxidative stress model. (A) 5% v/v and (B) 0.5% v/v of plasma samples added to MSCs culture media before 100 µM H2O2 treatment for 24 h. Abbreviations: Plasmas of healthy donors are presented as a control group; 1, 2, 3—plasma samples of T2D patients. 1—low antioxidant activity, cell viability less than 25%; 2—elevated antioxidant activity compared with control group; 3—antioxidant activity, cell viability in the range of 25–50%. Data are shown as median (interquartile range). * p < 0.05, ** p < 0.01 compared with control group.
