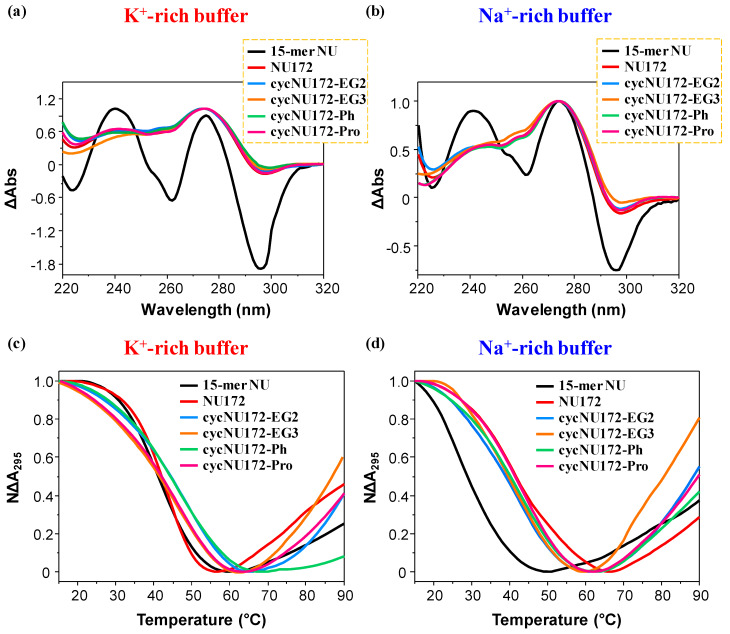
Figure 2.
Representative normalized TDS (a,b) and UV-melting profiles (c,d) of the cyclic NU172 derivatives (light blue, orange, green, and magenta lines, respectively for cycNU172-EG2, cycNU172-EG3, cycNU172-Ph and cycNU172-Pro). All the oligonucleotide samples were analyzed at 2 µM concentration in both the selected K+- (a,c) and Na+-rich (b,d) buffer solutions, in comparison with unmodified NU172 and NU (dark red and black lines, respectively). TDS profiles result from the subtraction of the UV spectrum registered at 15 °C from the 90 °C one. UV-melting profiles—recorded at 295 nm using a scan rate of 1 °C/min—are reported as normalized absorbance as a function of the temperature.

