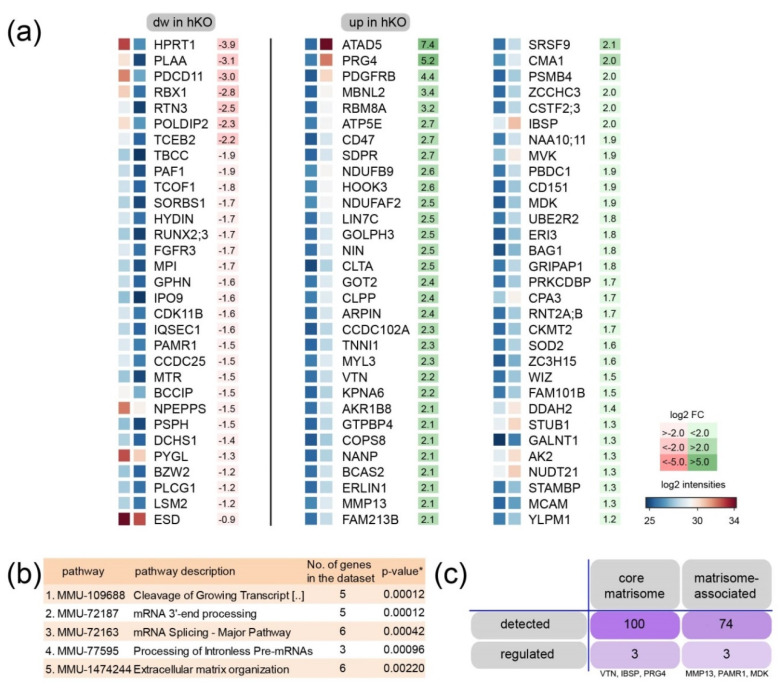
Figure 3.
Identification of regulated protein interaction networks in cartilage extracts from Mirc24 deficient mice. (a) Proteins with decreased (dw in hKO, left) and increased (up in hKO, right) intensity are ranked according to the fold change. The results of the (b) reactome pathway characterization of increased proteins within string database and the (c) matrisome analysis of regulated entities are shown.

