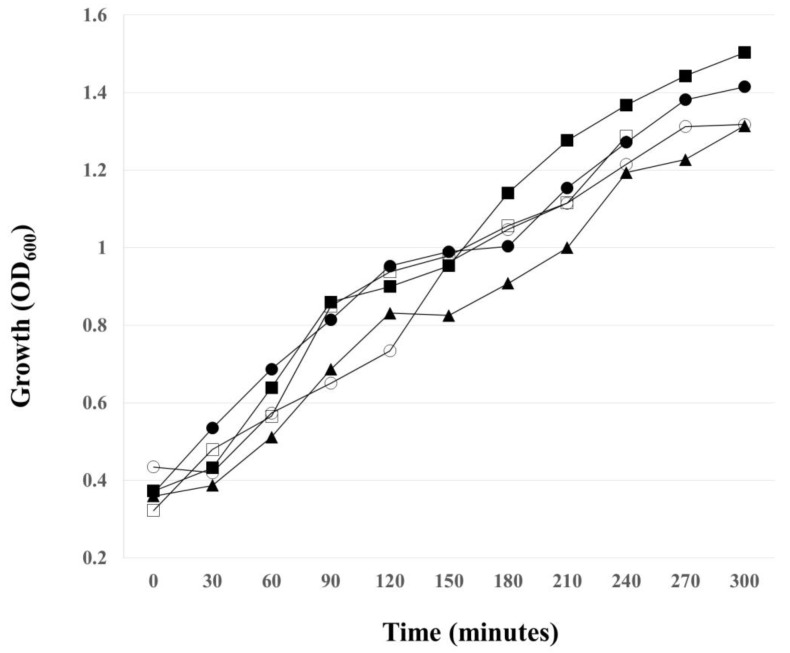
Figure A2.
Effect of sodium azide on the growth of H. influenzae cells lysogenized with HP1 phage. Then, 1 mM sodium azide was added at time 0 or 60 or 90 or 120 min after bacteria reached OD600 ~0.4 (time 0 on the graph) and the culture turbidity was then followed as a function of time. (○) Sodium azide added at time 0; (□) Sodium azide added 60 min after time 0; (▲) Sodium azide added 90 min after after time 0; (■) Sodium azide added 120 min after time 0; and (●) control culture, not treated with sodium azide. Results are representative of three independent experiments.

