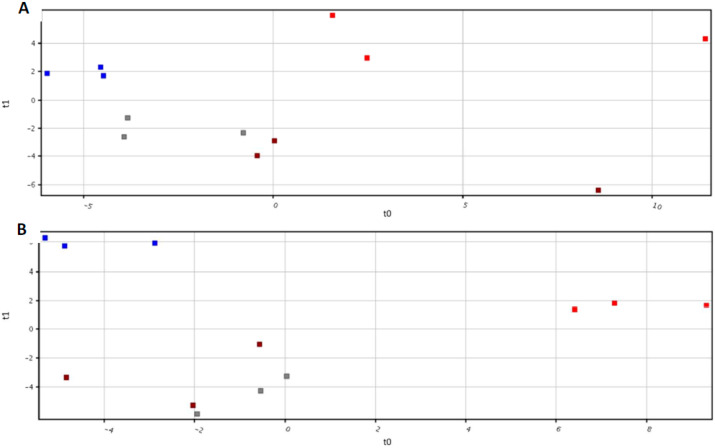
Figure 3.
Partial Least Squares Discriminant (PLS-DA) multivariate modelling from the dataset obtained through GC-MS (A) and UHPLC/QTOF-MS (B) analysis in the root exudates of plants exposed to the different nutritional conditions (Grey = Control, Blue = Fe deficiency, Brown = S deficiency, Red = dual deficiency).

