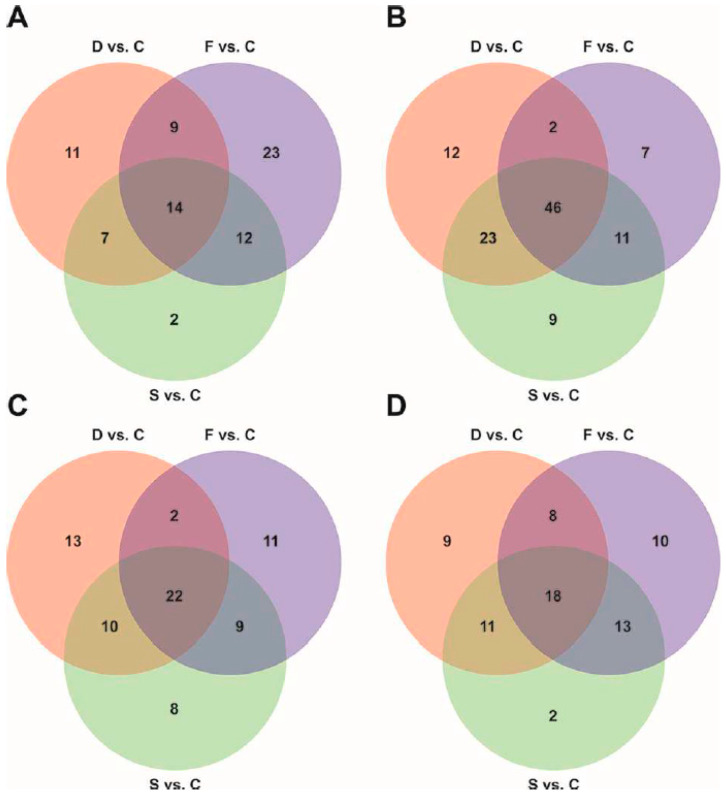
Figure 4.
Venn diagrams representing the differentially represented metabolites detected in the root exudates of plants exposed to the different nutritional conditions. (A) Number of up-regulated metabolites detected by GC-MS techniques and normalized on control samples. (B) Number of down-regulated metabolites detected by GC-MS techniques and normalized on control samples. (C) Number of up-regulated metabolites detected by HPLC-MS techniques and normalized on control samples. (D) Number of down-regulated metabolites detected by HPLC-MS techniques and normalized on control samples.

