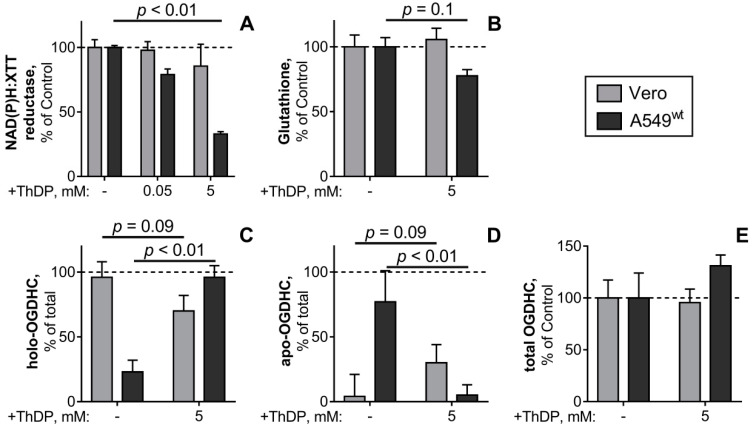
Figure 6.
The ThDP-induced changes in the levels of NAD(P)H:XTT reductase activity (A), glutathione (B), OGDHC partition into the holo- (C) and apoenzymes (D) and total activity of OGDHC (E) of the cell lines Vero (grey bars) or A549wt (black bars). The cells were cultured in standard DMEM, which was exchanged for the media with the indicated ThDP concentration (0–5 mM) 24 h before the assay of cellular NAD(P)H:XTT reductase activity or cell lysis for the glutathione and OGDHC assays. The data of at least three independent experiments are presented as means ±SEM. In A, B and D the % changes in cellular parameters are calculated relative to the values inherent in the same cells (A549wt or Vero) under control conditions (100%). The absolute values for the glutathione levels and OGDHC activities, taken as 100%, are given in Table 2. In C and D, the percentage of the holo- and apo-OGDHC is calculated relative to the total OGDHC activity in each of the settings, as described in the text regarding the data in Figure 1. Statistical significance of the changes in a cell line was determined by one-way ANOVA followed by Tukey’s post hoc test for multiple groups (A) or by Mann-Whitney test for two groups (B-E), with p-values presented on the graphs.

