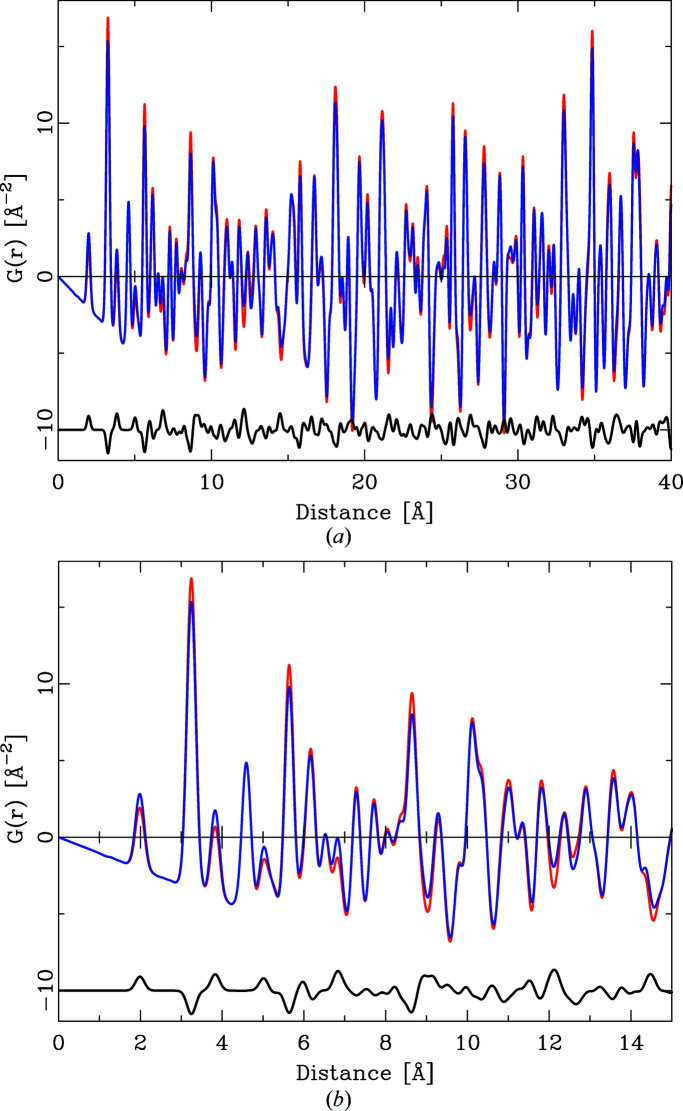
Figure 3.
(a) The effect of Q choice for X-ray atomic form factors on the calculated PDF. The red PDF (background) was calculated for ZnO using Q = 7 Å−1 and the blue PDF for Q = 0 Å−1. The black difference curve reflects the difference PDF(Q = 0 Å−1) − PDF(Q = 7 Å−1), offset for clarity. (b) Detail of the graph in panel (a) in the distance range 0–15 Å.

