Figure 5.
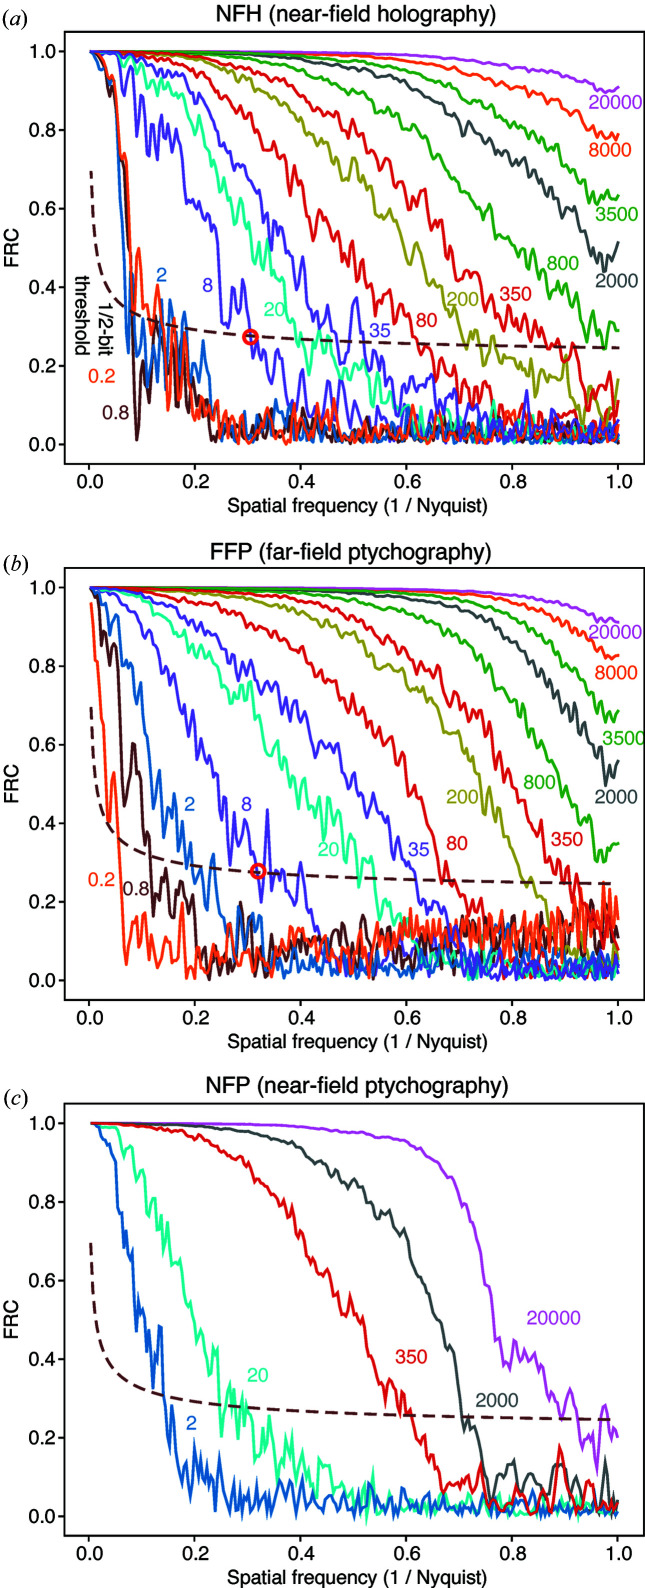
Fourier ring correlation (FRC) curves for two images reconstructed from separate instances of Poisson-noise-included simulated data sets, for (a) NFH, (b) FFP and (c) NFP. Only results obtained using the LSQ cost function of equation (7) are shown. Each curve is labeled with the fluence  in quanta per pixel. Also shown on the plot is the 1/2-bit threshold curve that is commonly used to define the achieved spatial resolution based on the spatial frequency of the crossing with the experimental FRC curve (van Heel & Schatz, 2005 ▸), as indicated by red circles for a fluence of 8 in (a) and (b). These FRC crossing normalized spatial frequencies are used in Fig. 6 ▸.

