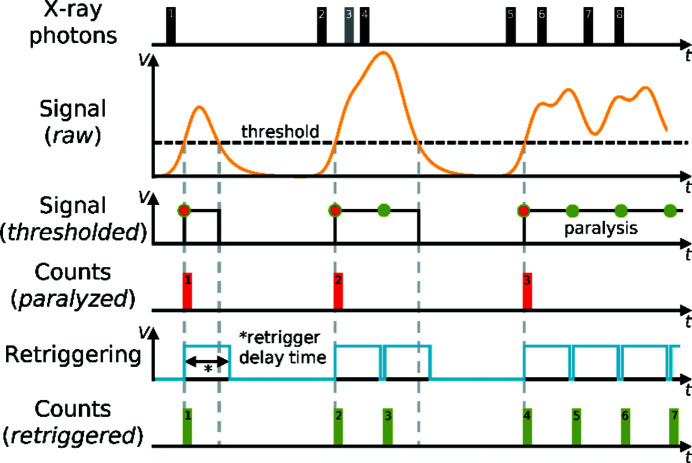
Figure 1.
Instant retrigger technology implemented in the DECTRIS Pilatus3 detectors (Trueb et al., 2015 ▸). The black and grey rectangles (1–8) illustrate the individual events of impinging photons. The yellow signal waveform (labelled Signal, raw) shows the associated charge build up in the sensor of the detector, with the threshold indicated with a black dashed line. The black curve (Signal, thresholded) shows the counting of the paralyzable mode (red rectangles, 1–3), whereas the blue curve (Retriggering) shows the re-enabling of the counting circuit after the retrigger delay time, whence the counting of the retriggered mode follows (green rectangles, 1–7). The grey rectangle (3) illustrates a lost photon of a bunch (2–4) whose incoming rate exceeded the inverse of the retrigger delay time (retrigger frequency) and a count-rate correction would be necessary. The figure has been modified and reproduced with permission from Trueb et al. (2015 ▸).

