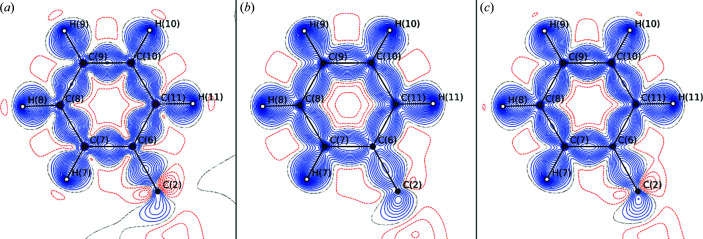
Figure 11.
Deformation density contour maps (level of 0.05 e Å−3) of rubrene for models derived from data using a significance cutoff in I/σ(I) of 3 and truncated resolution (1.43 Å−1). The deformation density is shown for (a) the IP data, (b) the multipole projected theoretical data and (c) the P3 data. Maps (including the Laplacian) for models derived from all data can be found in Section S12 in the supporting information.

