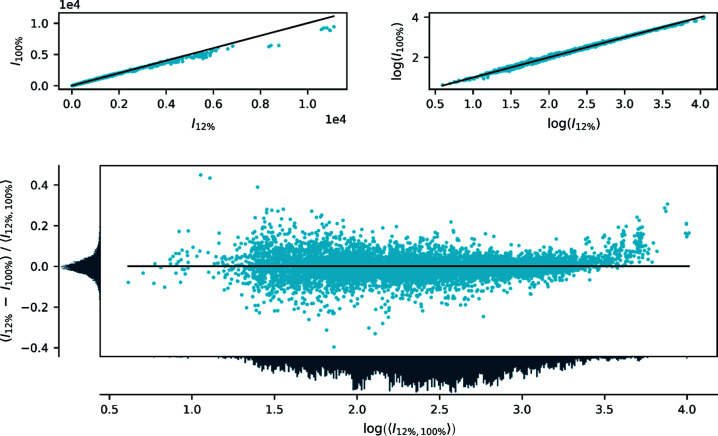
Figure 2.
Comparison of integrated, scaled and averaged diffraction intensities of FeSb2 collected with 12 and 100% of the full beam intensity. The top panels show a direct comparison of intensities on linear (left) and logarithmic (right) scales, and the bottom panel shows the relative difference between the two data sets defined as the difference divided by the mean value as a function of the logarithm of the average intensity. The panels to the left of and below the bottom plot are histograms showing the distribution of data on the two axes. The data are scaled to be similar but the overall scale is arbitrary.

