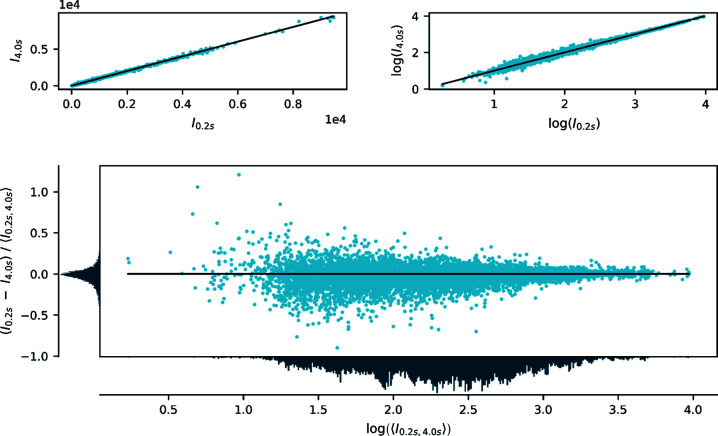
Figure 3.
Comparison of integrated, scaled and averaged diffraction intensities of FeSb2 collected using an attenuation to 12% with exposure times of 0.2 and 4.0 s per frame (with a scan width of 0.5° per frame). The panels are the same as in Fig. 2 ▸.

