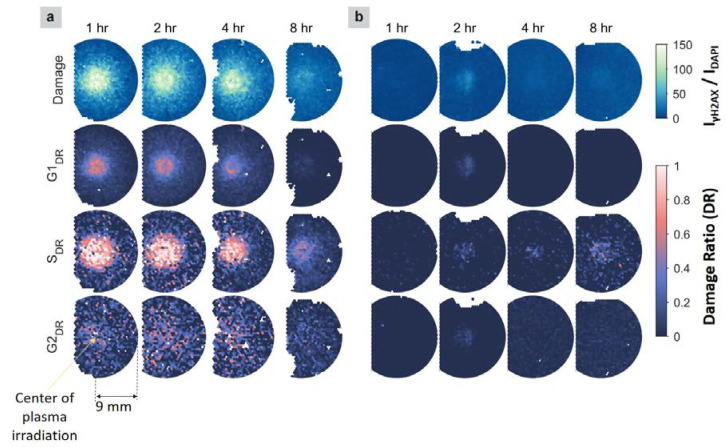
Figure 3.
2D distributions of the damaged DNA fraction in each nucleus (top row) and the damage ratios (DRs) for cells in G1, S, and G2 phases (rows 2–4), based on γH2AX staining in malignant cells (a) and nonmalignant cells (b) grown on coverslips. The damage threshold used to determine the DR was 75 (noting the damage range is 0–150). Each circular distribution, with a diameter of 18 mm, is centered on the treatment locations. Locations with white patches indicate regions without cells or blurry regions of the image, which were discarded. The circles for the cancer cells are cut off on the left side, due to a limitation of the slide scanner.

