Figure A1.

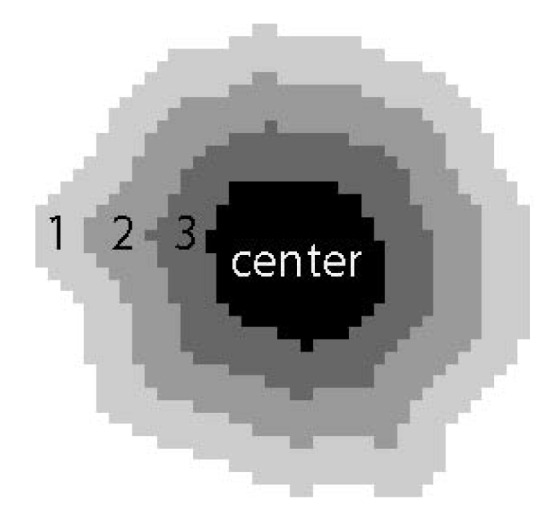
Radial intensity features. Example of the 3 rings with a width of 4 pixels and the center region. In each of these four regions, the mean and standard deviation of the intensity are computed.

Radial intensity features. Example of the 3 rings with a width of 4 pixels and the center region. In each of these four regions, the mean and standard deviation of the intensity are computed.