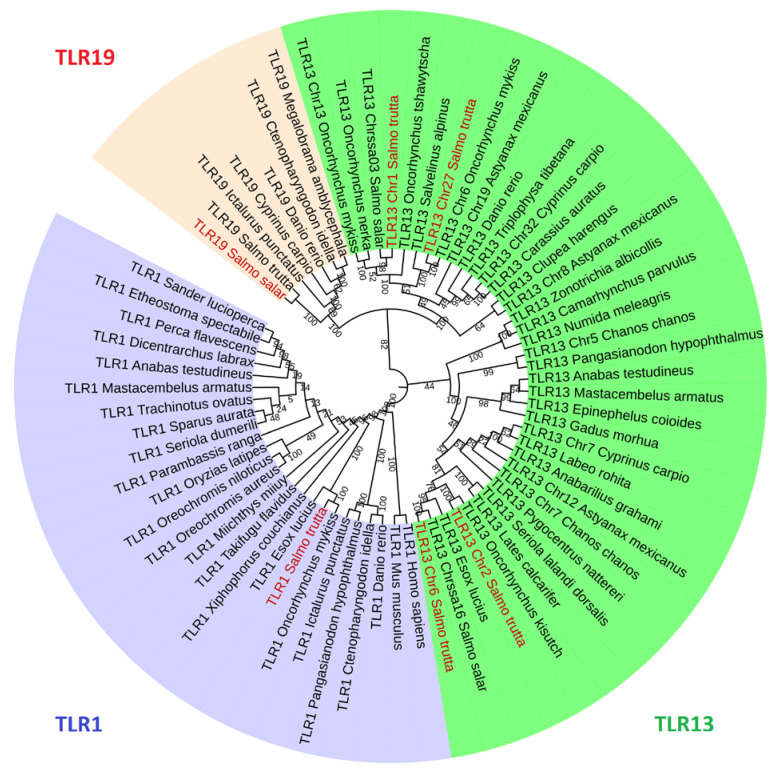
Figure 5.
Phylogenetic tree of TLRs from different vertebrates. The tree was generated using MEGA X using the maximum likelihood method. The different gene groups are denoted by various colors, TLR1—blue; TLR19—red; TLR13-like—dark green. The leaves with red legend indicate brown trout TLRs. The GenBank accession numbers of the sequences are available in Supplementary Table S2.

