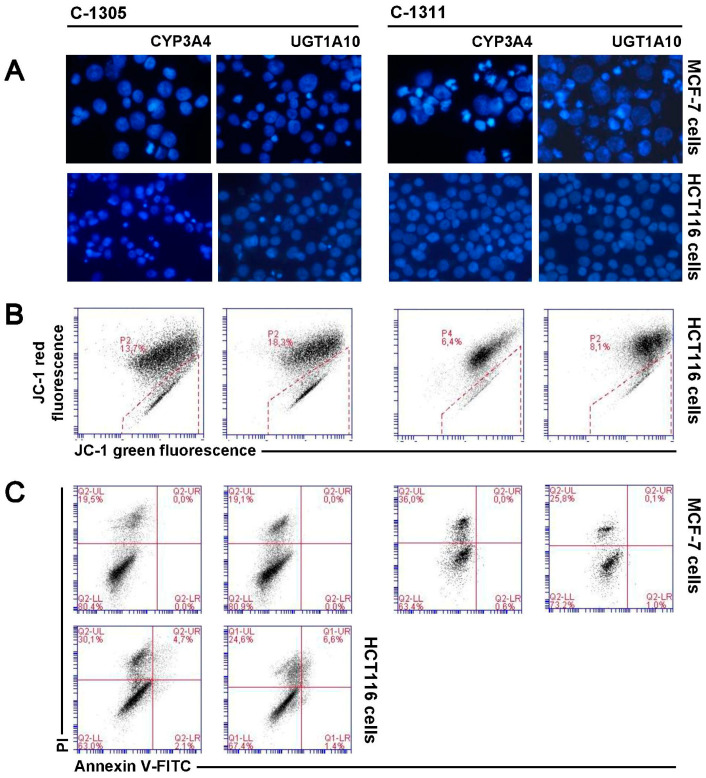
Figure 8.
Cellular response of MCF-7-CYP3A4, MCF-7-UGT1A10, HCT116-CYP3A4 and HCT116-UGT1A10 cells to 120 h of C-1305 and C-1311 treatment. (A) Representative analysis of changes in nuclear morphology of two types of MCF-7 and HCT116 cells exposed to C-1305 and C-1311 (IC80 for MCF-7, IC90 for HCT116). Cells were stained with DAPI (1 mg/mL) and visualized under fluorescent microscope (400× magnification); (B) Cytometric analysis of changes in mitochondrial transmembrane potential (ΔΨm) in two types of HCT116 cells treated with both compounds and labeled with JC-1 dye. Cytograms are representative of three independent experiments. Marked gates are populations of cells with decreased mitochondrial transmembrane potential (ΔΨm) (green fluorescence); (C) Phosphatidylserine externalization and membrane disruption in two types of MCF-7 and HCT116 cells after 120 h of treatment with C-1305 and C-1311. Representative bivariate flow cytometry histograms of annexin V-FITC signal versus PI signal. Bottom left quadrant represents live cells (annexin V negative, PI negative); bottom right quadrant represents early apoptotic cells (annexin V positive, PI negative); top right quadrant represents late apoptotic cells (annexin V positive, PI positive); top left quadrant represents primary necrotic cells (annexin V negative, PI positive). Annexin V/PI test could not be performed for HCT116 cells because of too high autofluorescence of 10 µM C-1311.

