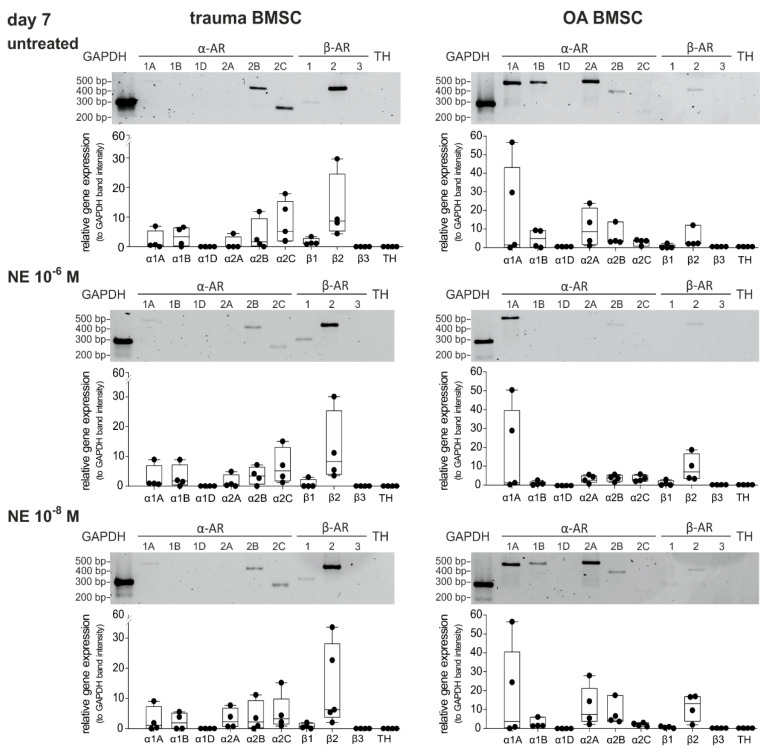
Figure 4.
Changes in AR expression after NE treatment. Gene expression of different AR subtypes in untreated trauma and OA BMSCs in monolayer culture at day 7 and after treatment with NE 10−6 M and NE 10−8 M (representative image of one trauma and OA patient) and average score of gene expression (n = 4, mean ± standard deviation). Data are shown as box plots explained in legend to Figure 1.

