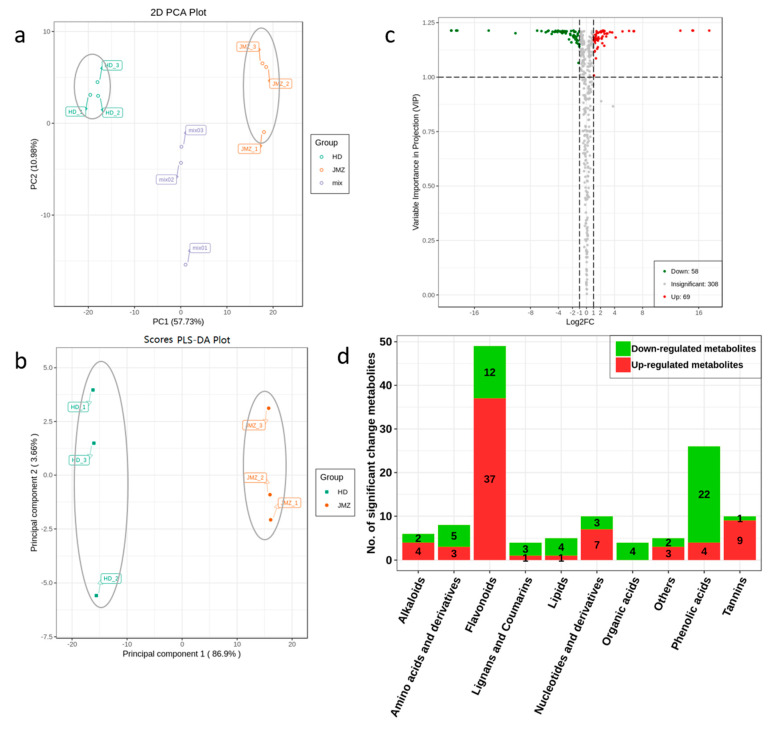
Figure 2.
Multivariate statistical analysis of metabolites from C. sinensis cv. Jinmingzao (JMZ) and C. sinensis cv. Huangdan (HD). (a) PCA score plot of metabolites of the young shoots of JMZ (red) and HD (green); the x-axis represents the first principal component and the y-axis represents the second principal component. (b) PLS-DA score plot of metabolites between the young shoots of JMZ (red) and HD (green). (c) Volcano plots of metabolites between the young shoots of JMZ and HD. Metabolites with q-value > 0.05 are highlighted in red for upregulation and in green for downregulation; and (d) The 127 SCMs were divided into 10 categories.

