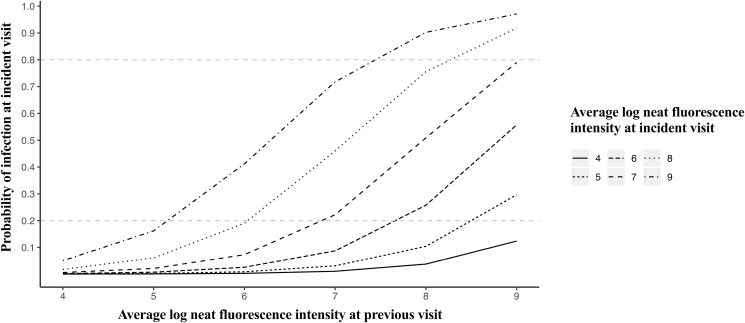
Figure 6.
Probability of infection based on anti-interferon-γ autoantibody levels at 2 consecutive visits in the Thai cohort. A model including a term for lagged neat fluorescence intensity was used to assess whether autoantibody levels at 2 consecutive visits inform the presence of infection at the latter visit in the Thai cohort. The y-axis shows the probability of infection at the incident visit based on the autoantibody levels at a previous visit (x-axis) and the incident visit (lines on the graph).

