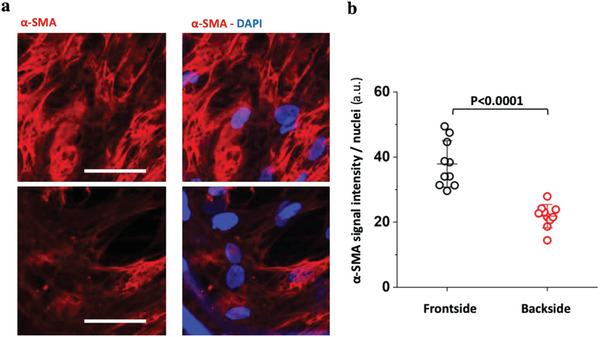
Figure 3.

Differential α‐SMA content of de novo grown engineered tissues that faced either the high‐velocity or the low‐velocity pulsatile flow after 21 days of culture. a) Representative images of tissue sections that faced the high (front) versus low (back) flow velocity, respectively, immunostained for α‐SMA (red) and nuclei (blue). b) Corresponding pixel‐by‐pixel analyses normalized to nuclei counts revealed higher presentation of α‐SMA‐positive cells on side facing the high flow velocity. Minimum three images from a triplicate experiment were analyzed. Scale bar 50 µm. Statistics were calculated by one‐way ANOVA and Bonferroni post hoc test.
