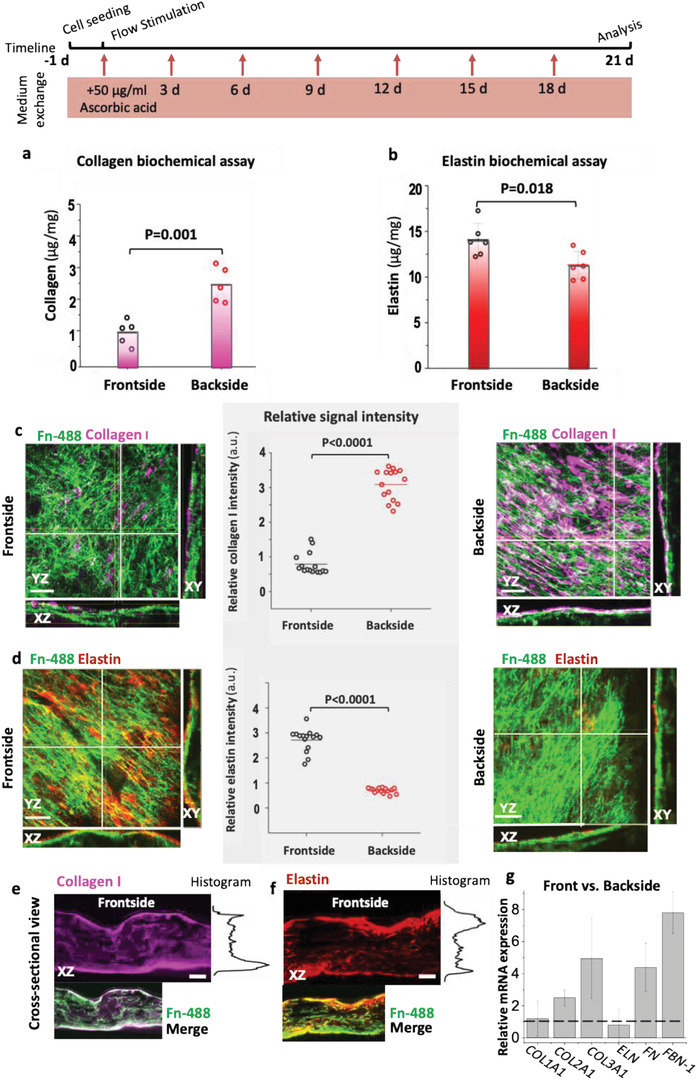
Figure 4.

Differential deposition of collagen I and elastin in the front and backsides of the engineered tissues. The timeline summarizes how the samples have been treated from cell seeding to the analysis. a) Total acid‐pepsin soluble collagen and b) elastin concentrations were measured by biochemical assays (Sircol and Fastin, respectively) in tissues harvested from either the front or the backsides. Representative stack maximum projection intensity images of the front and backsides of tissues, which were immunostained after 3 weeks in culture for c) collagen I (magenta) and d) elastin (red). The corresponding single‐channel images are shown in Figure S2, Supporting Information. The coordinates in images are defined according to Figure 1. The outer surface layers contacting the medium used for the analyses were ≈50 µm thick. Their protein contents were assessed by comparative pixel‐by‐pixel intensity analysis of the respective immunostained images. Fibronectin was visualized not by immunostaining, but by supplementing labeled Alexa Flour 488 human plasma fibronectin (green) to the cell culture medium.[ 38 ] Cross‐sectional views show the assembly of fibronectin, collagen I (e) and elastin (d) on the surface and inside the tissues. g) Relative mRNA analysis of collagens (COL1A, COL2A1, and COL3A1), elastin (ELN) at day 21. Number of biological replicates was 3 and ≥5 images were analyzed per replicate. Statistics were calculated by one‐way ANOVA, Bonferroni post‐hoc test. Scale bars c,d) 50 µm and e,f) 200 µm. See also Figures S4–S6, Supporting Information, for single‐stack confocal images of collagen I, III, and elastin, respectively.
