
Figure 2.
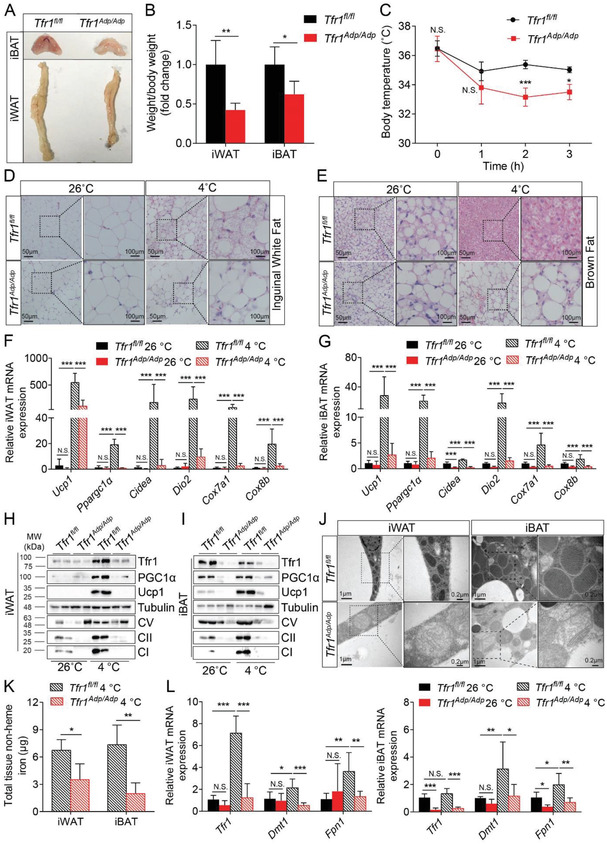
Adipocyte‐specific deletion of Tfr1 reduces cold‐induced adipocyte thermogenesis. A) Representative images of iBAT and iWAT tissues from control (Tfr1fl/fl) and Tfr1Adp/Adp mice. B) Tissue weight of iBAT and iWAT in control (Tfr1fl/fl) and Tfr1Adp/Adp mice, expressed relative to the respective control (n = 4–5 mice per group), presented as mean ± SD, pooled from two independent experiments. C) Time course of rectal temperature of Tfr1fl/fl and Tfr1Adp/Adp mice at 4 °C (n = 4–5 mice per group), presented as mean ± SD, pooled from two independent experiments. D,E) Representative images of H&E‐stained iWAT and iBAT sections from Tfr1fl/fl and Tfr1Adp/Adp mice housed for 7 days at room temperature (26 °C) or 4 °C (n = 4–6 mice per group. F,G) qRT‐PCR analysis of thermogenesis‐related gene expression in iWAT and iBAT samples from Tfr1fl/fl and Tfr1Adp/Adp mice housed for 7 days at 26 or 4 °C (n = 4–6 mice per group), presented as mean ± SD, pooled from three independent experiments. H,I) Representative western blot images of iWAT and iBAT samples from Tfr1fl/fl and Tfr1Adp/Adp mice housed for 7 days at 26 or 4 °C (n = 4–6 mice per group). J) Representative transmission electron microscopy images of iWAT and iBAT samples from Tfr1fl/fl and Tfr1Adp/Adp mice. K) Total tissue non‐heme iron in iWAT and iBAT in Tfr1fl/fl and Tfr1Adp/Adp mice housed for 7 days at 26 or 4 °C (n = 4–6 mice per group), presented as mean ± SD, pooled from three independent experiments. L) qRT‐PCR analysis of iron metabolism related gene expression in iWAT and iBAT from Tfr1fl/fl and Tfr1Adp/Adp mice housed for 7 days at 26 or 4 °C (n = 4–6 mice per group), presented as mean ± SD, pooled from three independent experiments. *p < 0.05, **p < 0.01, ***p < 0.001 and N.S., not significant. Unpaired Student's t‐test was used for comparison between two groups. One‐way ANOVA with a Bonferroni post hoc analysis was used for comparison among multiple groups.