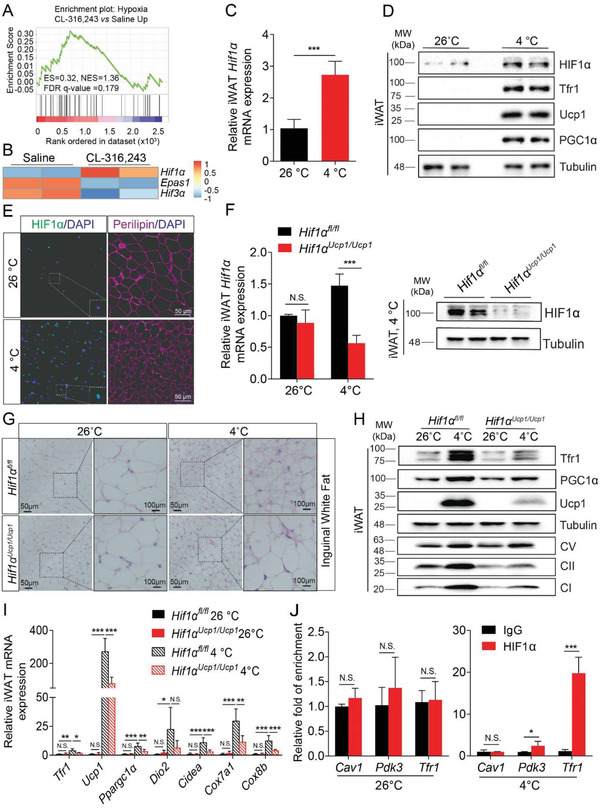
Figure 4.

Nuclear HIF1α transactivates Tfr1 expression in beige adipocytes. A) GSEA analysis of upregulated pathways in response to hypoxia. B) Heatmap of hypoxia‐inducible factor (HIF)‐related gene expression in beige adipocytes. C) qRT‐PCR analysis of Hif1α expression in white adipocytes in C57BL/6J mice housed at 26 or 4 °C for 7 days (n = 6 mice per group), presented as mean ± SD, pooled from two independent experiments. D) Representative western blot analysis of HIF1α, Tfr1, Ucp1, PGC1α, and Tubulin in iWAT from C57BL/6J mice housed at or 4 °C for 7 days (n = 6 mice per group). E) Representative images of iWAT sections obtained from C57BL/6J mice housed at 26 or 4 °C for 7 days and immunostained for HIF1α and Perilipin (n = 6 mice per group). F) qRT‐PCR and western blot analysis of Hif1α expression in iWAT in Hif1αfl/fl and Hif1αUcp1Ucp1 mice housed at 26 or 4 °C for 7 days (n = 4 mice per group), presented as mean ± SD, pooled from two independent experiments. G) Representative images of H&E‐stained iWAT sections from Hif1αfl/fl and Hif1αUcp1Ucp1 mice housed at 26 or 4 °C for 7 days (n = 4 mice per group). H) Representative western blot analysis of Tfr1, PGC1α, Ucp1, tubulin, and mitochondrial complexes I, II, and V in iWAT samples from Hif1αfl/fl and Hif1αUcp1Ucp1 mice housed at 26 or 4 °C for 7 days (n = 4 mice per group). I) qRT‐PCR analysis of the indicated adipocyte thermogenesis‐related genes in iWAT of Hif1αfl/fl and Hif1αUcp1Ucp1 mice housed at 26 or 4 °C for 7 days (n = 4 mice per group), presented as mean ± SD, pooled from two independent experiments. J) HIF1α‐ChIP‐qPCR showing the fold enrichment at the Cav1, Pdk3, and Tfr1 promoters in beige adipocytes isolated from GFPUcp1/Ucp1 mice housed at 26 or 4 °C for 7 days (n = 6), presented as mean ± SD. *p < 0.05, **p < 0.01, ***p < 0.001, and N.S., not significant. Unpaired Student's t‐test was used for comparison between two groups. One‐way ANOVA with a Bonferroni post‐hoc analysis was used for comparison among multiple groups.
