Figure 1.

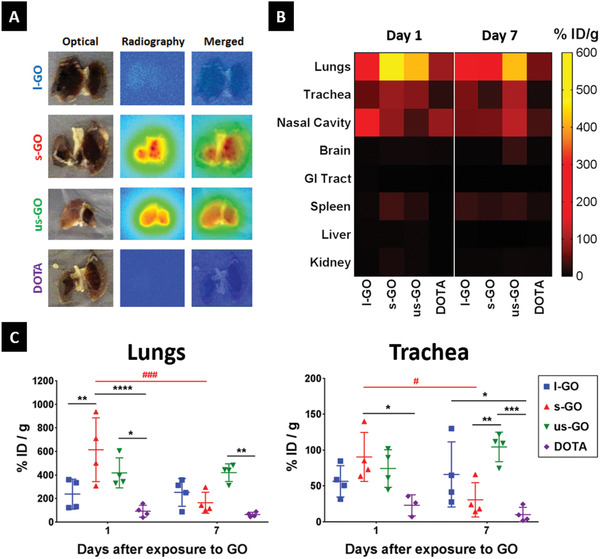
GO sheets translocate to the lower respiratory tract after intranasal instillation. Mice were instilled with DOTA‐functionalized GO sheets labeled with 115In (natural) or 111In (radioactive), and the organs were collected 1 and 7 days after exposure. A) Autoradiography of lungs dissected from mice instilled with GO‐DOTA[111In] 1 day after exposure. B) Heatmap illustrates tissue distribution and persistence of GO‐DOTA[115In] in the respiratory tract compared to DOTA[115In] control, at days 1 and 7 after i.n. instillation. Each block represents the mean amount of GO in the respective organ, quantified by ICP‐MS, which was normalized as % instilled dose (ID) per gram of dry tissue. C) Quantification of 115In by ICP‐MS in the lungs and trachea from mice exposed to GO‐DOTA[115In] or the DOTA[115In] control reveals size‐dependent distribution of GO in the respiratory tract. Individual data points corresponding to each animal are plotted alongside mean ± SD (n = 4). Data were analyzed using a two‐way ANOVA test with post hoc Sidak's multiple comparisons test. Significant differences between treatments are plotted with (*), whereas differences over time are plotted with (#). In both cases, statistical significance is reported as: (*), p < 0.05; (**), p < 0.01; (***), p < 0.001; (****), p < 0.0001. Remaining organs are plotted in Figure S2, Supporting Information.
