
Figure 3.
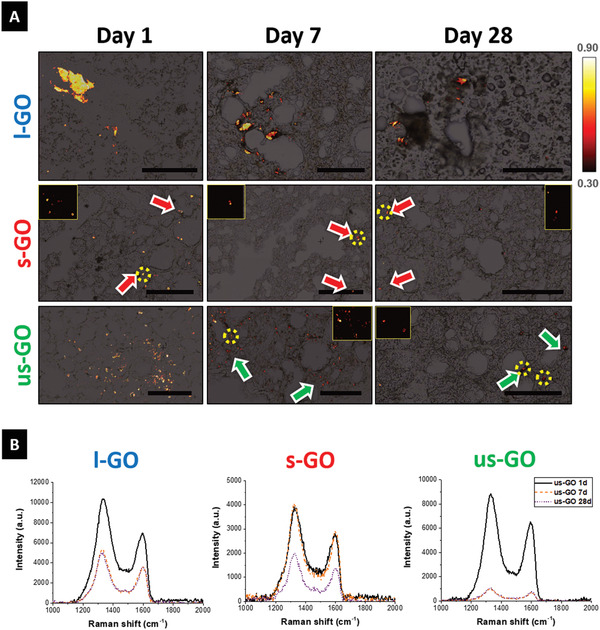
GO sheets undergo biodegradation and/or clearance from the lungs after pulmonary exposure. Lung cryosections were obtained from mice exposed to l‐GO, s‐GO, and us‐GO. A) Raman maps are plotted overlaying bright‐field images, with the intensity scale referring to the correlation between the acquired spectrum for each pixel of the map and the reference spectrum of GO presented in Figure S4, Supporting Information. Presence of s‐GO and us‐GO is emphasized in inset figures, corresponding to areas highlighted in yellow. Scale bars = 100 µm. B) Representative Raman spectra corresponding to the average spectrum at each time point evidence biotransformation of GO in the lungs, with decreased signal intensity and spectroscopic changes including the shifted position of the G band and the variation in the relative intensity of the D band.