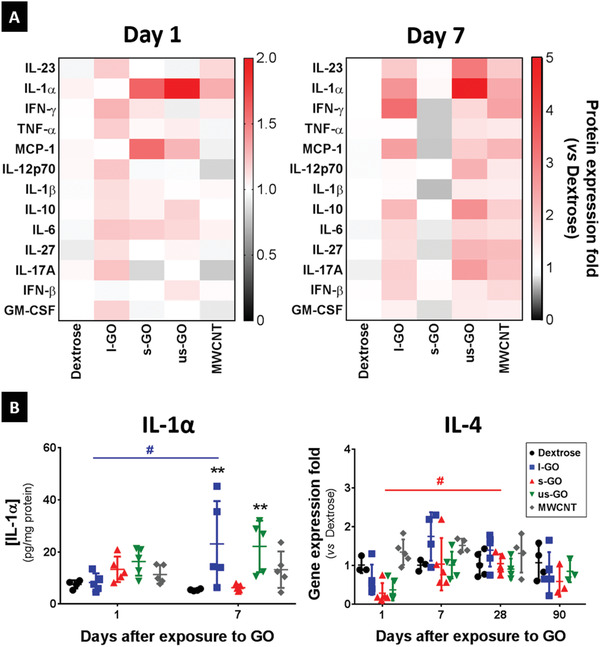
Figure 5.

Inflammatory responses to l‐GO in the lungs are characterized by the secretion of Th1 cytokines. Small portions of each individual lobe were dissected for protein and RNA extraction. A) Heatmap showing the cytokine and chemokine expression levels of each treatment, normalized by protein content. Each block corresponds to the median value, after normalization to the average protein expression level in the negative control (Dextrose). Cytokine and chemokine expression levels were determined using a LEGENDplex Mouse Inflammation Panel kit, and normalized to protein concentration determined by BCA assay. B) Individual data points corresponding to each animal are plotted alongside mean values ± SD (n = 4–5). Statistical analysis of data acquired using the LEGENDplex assay was performed using a 2‐way ANOVA test with post hoc Sidak's multiple comparisons test, whereas gene expression of IL‐4 was analyzed using a Kruskal–Wallis test with post hoc Dunn's multiple comparisons test. In both cases, each treatment was only compared against the negative control: (*), p < 0.05; (**), p < 0.01. The temporal variation in the expression of IL‐4 was also analyzed using a Kruskal–Wallis test with post hoc Dunn's multiple comparisons test: (#), p < 0.05.
