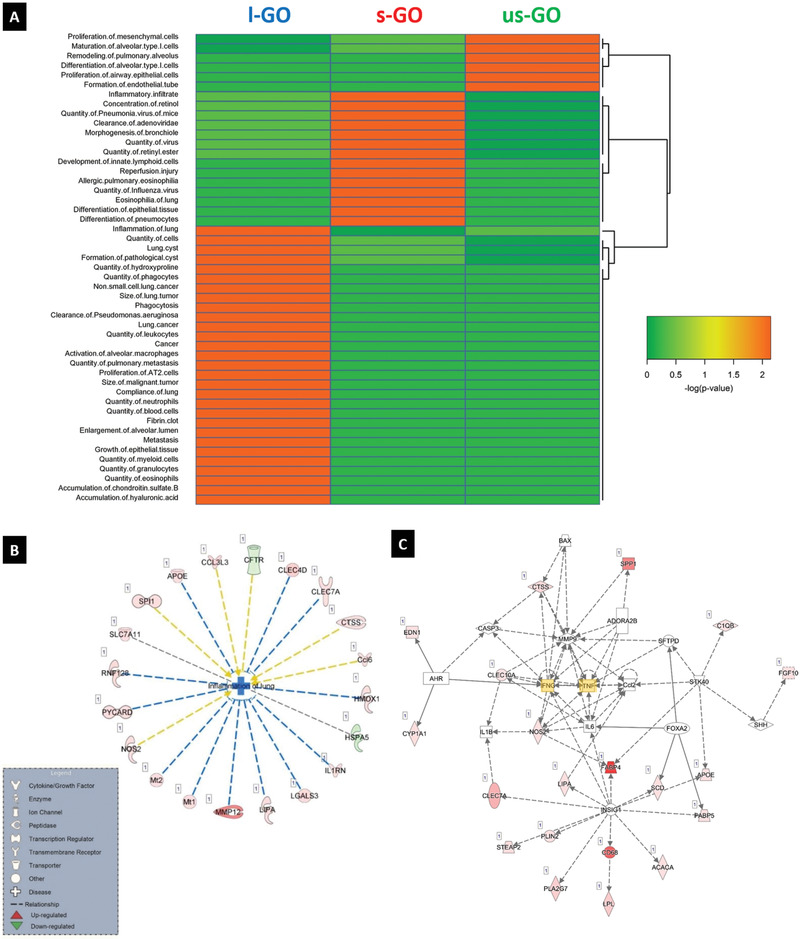
Figure 6.

RNA‐seq analysis reveals size‐dependent effects of GO in inflammation‐related pathways. A) Hierarchical clustering analysis of the top diseases and biofunctions pathways identified by IPA in lung tissue samples of mice exposed for 28 days to us‐GO, s‐GO, and l‐GO. DEGs having ≥0.5 log fold change and ≥ 0.05 FDR were included in the analysis. The color coding in the heatmap depicts the p‐values for the pathways shown. B) IPA analysis was conducted on DEGs identified at day 28 post exposure. The pathway inflammation of the lung was significantly affected in lungs of animals exposed to l‐GO. Red denotes upregulated genes, and green denotes genes that are downregulated. C) Network analysis of DEGs identified in the lungs of mice at 28 days post‐exposure to l‐GO. IPA suggested that IFN‐γ and TNF‐α (highlighted in yellow) are main regulators of the affected pathways by l‐GO.
