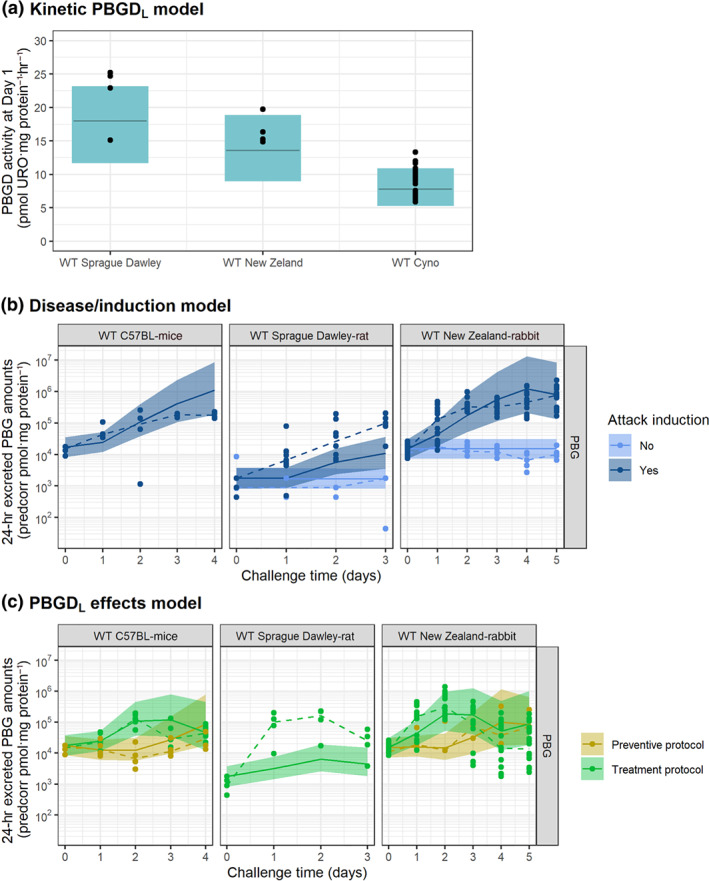
FIGURE 4.

Evaluation of model performance in WT animals untreated or after administration of hPBGD mRNA drug product. Coloured areas represent the 80% model prediction interval, solid lines are the median model prediction, dashed lines are the observed median, and symbols represent raw observations. Plots have been prediction corrected (predcorr) to enable representation of multiple experimental designs
