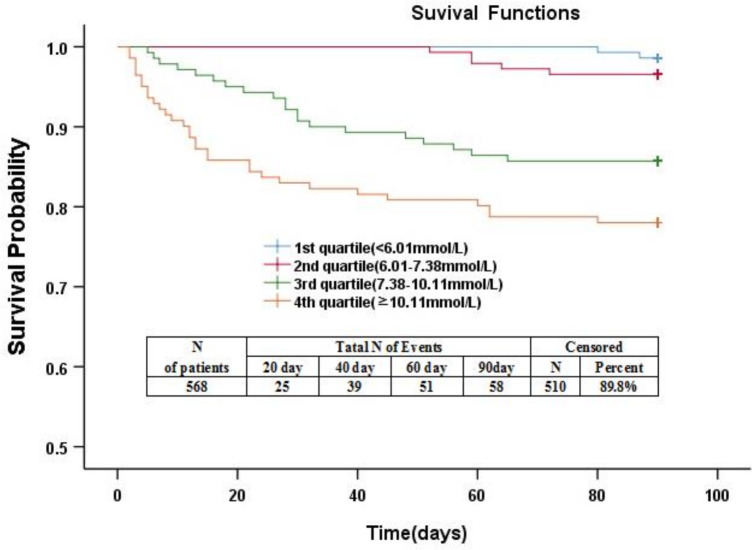
Figure 4.
Kaplan-Meier survival based on fasting blood glucose (FBG) quartiles. Time to death was analysed by Kaplan-Meier curves based on FBG quartiles. Patients in the lower two quartiles (FBG, ≤6.00 mmol/L; FBG, 6.01–7.37 mmol/L) had a lower risk of mortality compared with patients with FBG levels in the higher two quartiles (FBG, >10.10 mmol/L; FBG, 7.38–10.10 mmol/L; p<0.0001).

