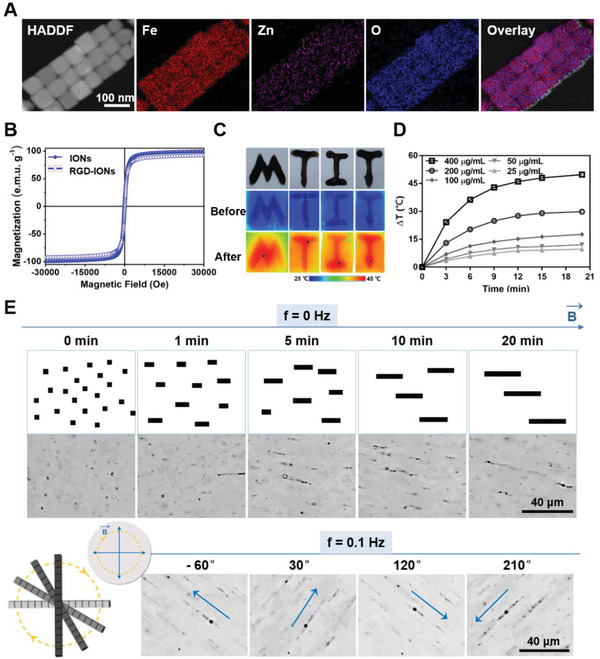
Figure 1.

Characterization of the IONs’ physical properties. A) Elemental mapping analysis showing the composition and element distribution of IONs. B) Magnetic properties represent by M–H curves of IONs and RGD‐IONs (temperature: 298 K). C) Infrared thermal images with letter‐shaped acrylamide gel coating RGD‐IONs under AMF with frequency of 375 kHz for 20 min. D) Temperature raised curves of RGD‐IONs with different iron concentrations dispersed in water under AMF with frequency of 375 kHz for 20 min recorded by IR thermometer. E) Optical images showing the assembly of RGD‐IONs and rotation under RMF with strength of 40 mT and frequency of 0.1 Hz (the scare bar: 40 µm).
